Cards
Against
Humanity’s
Pulse of the Nation
The Poll
For the fifth day of Cards Against Humanity Saves America, we used your money to fund one year of monthly public opinion polls. We’ll ask the American people about their social and political views, what they think of the president, and their pee-pee habits.
In fact, we secretly started polling three months ago. What a delightful surprise!
To conduct our polls in a scientifically rigorous manner, we’ve partnered with Survey Sampling International
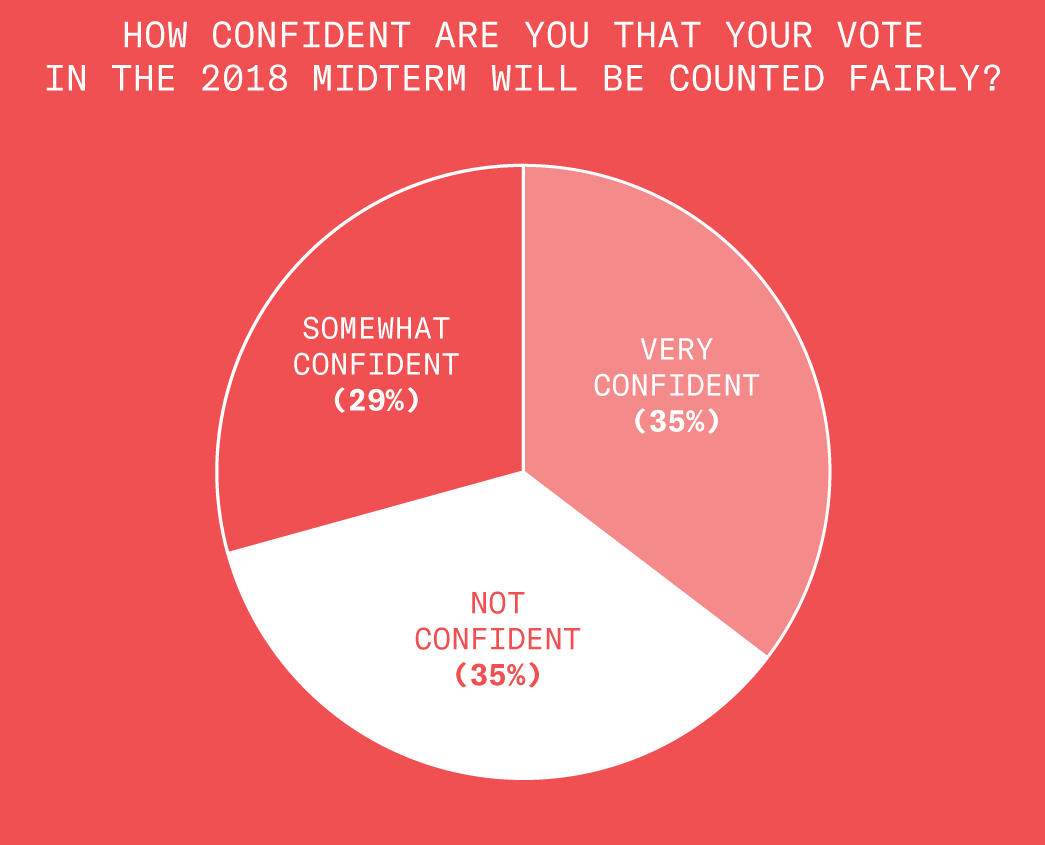
The Future of Democracy
We asked people how confident they were that their votes would be counted fairly in the 2018 midterms.
The Future of Democracy – 2 of 5
Democrats are less confident than Republicans that their votes will be counted fairly.
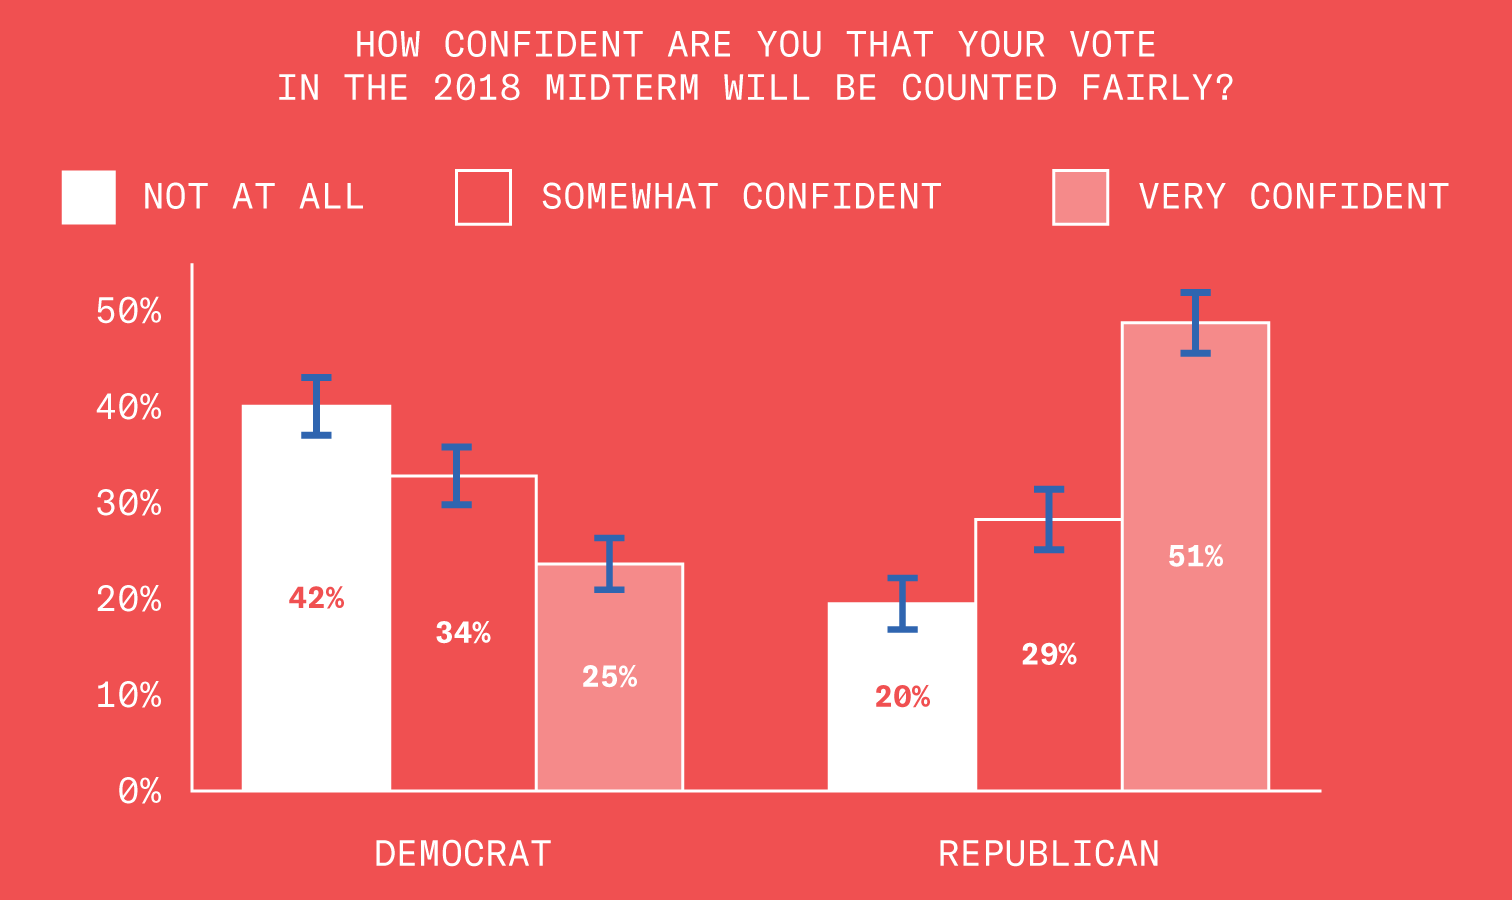
This is probably because Democrats know that Russia interfered with the previous election.
The Future of Democracy – 3 of 5
Research shows that instant-runoff voting (in which people vote for their first choice candidate, their second choice candidate, and so forth) is superior to the shitty system we have now.
Unfortunately, only a slim majority of Americans support this kind of voting system.

The Future of Democracy – 4 of 5
Younger people are more okay with instant-runoff voting than older people. Which is good news, because old people are going to die soon.

The Future of Democracy – 5 of 5
Republicans are less supportive of instant-runoff voting than Democrats, probably because the status quo is working out pretty well for them.

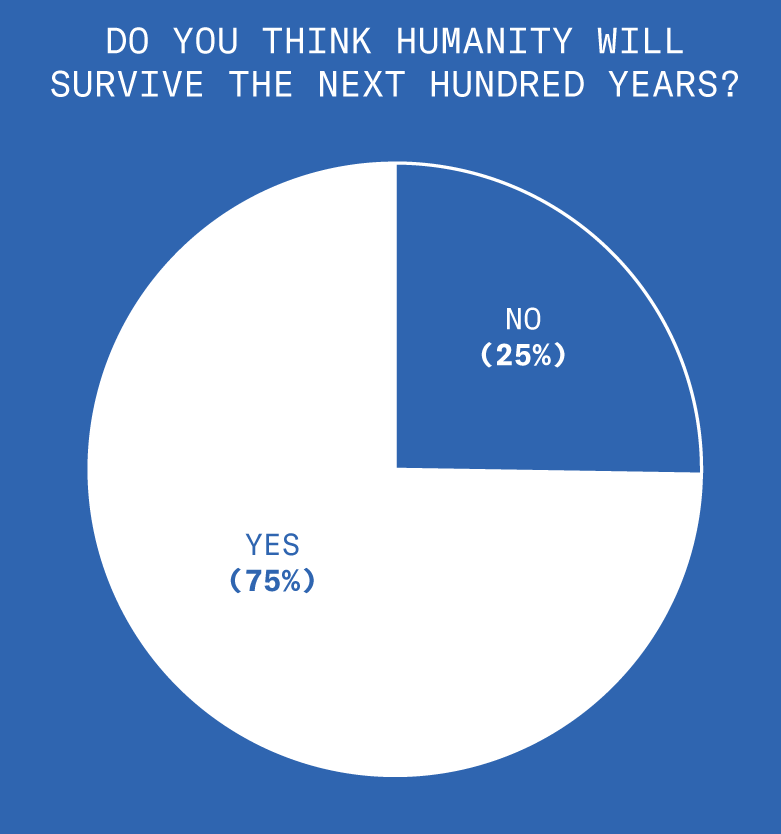
The Future of Humanity
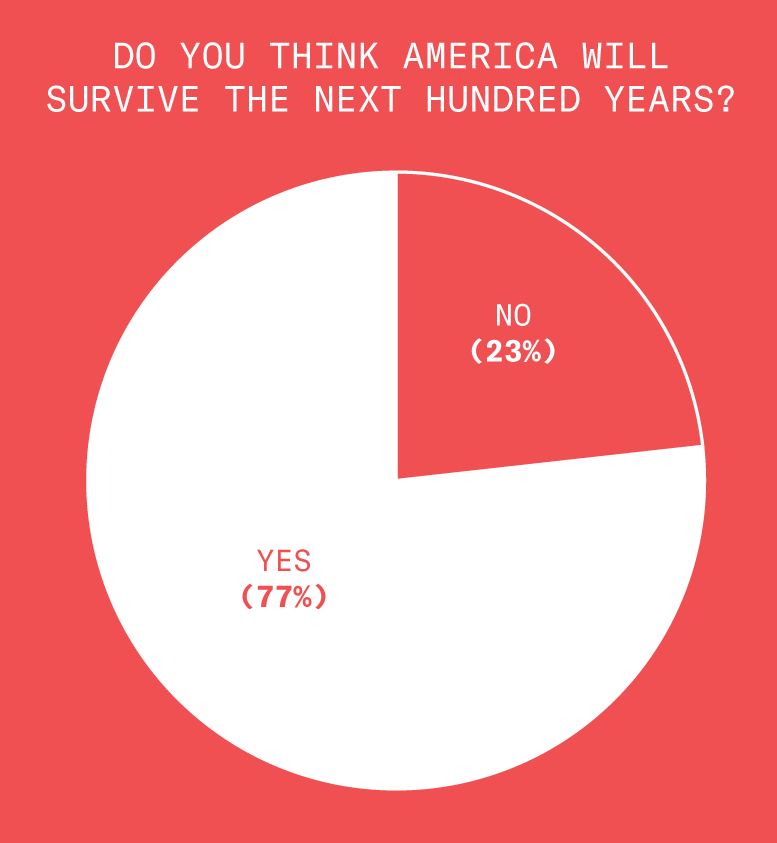
People are pretty optimistic that humanity will survive the next hundred years.
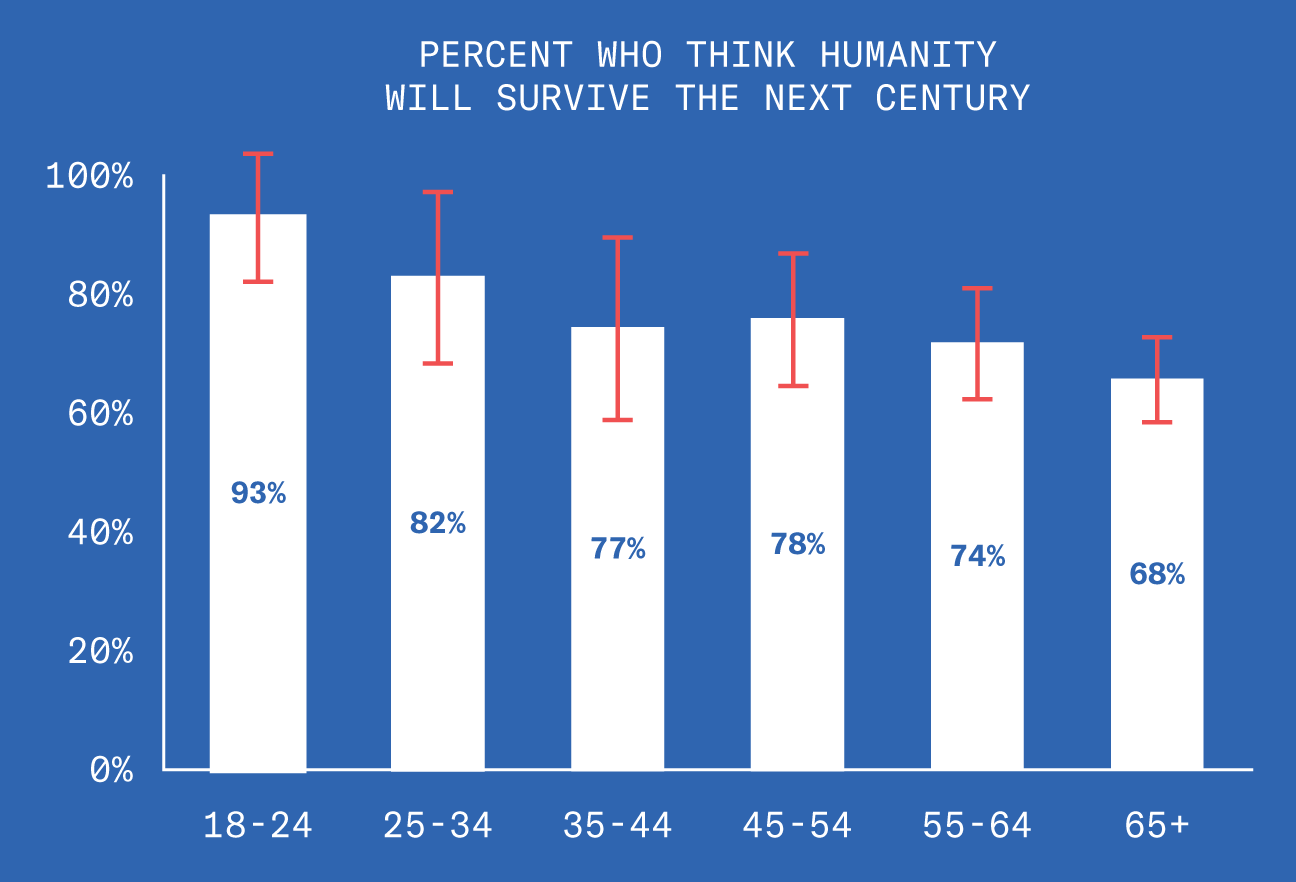
The Future of Humanity – 2 of 5
Millennials are more optimistic about humanity than their older, gloomier peers. Or alternatively, they are more in denial than their older, wiser peers.
The Future of Humanity – 3 of 5
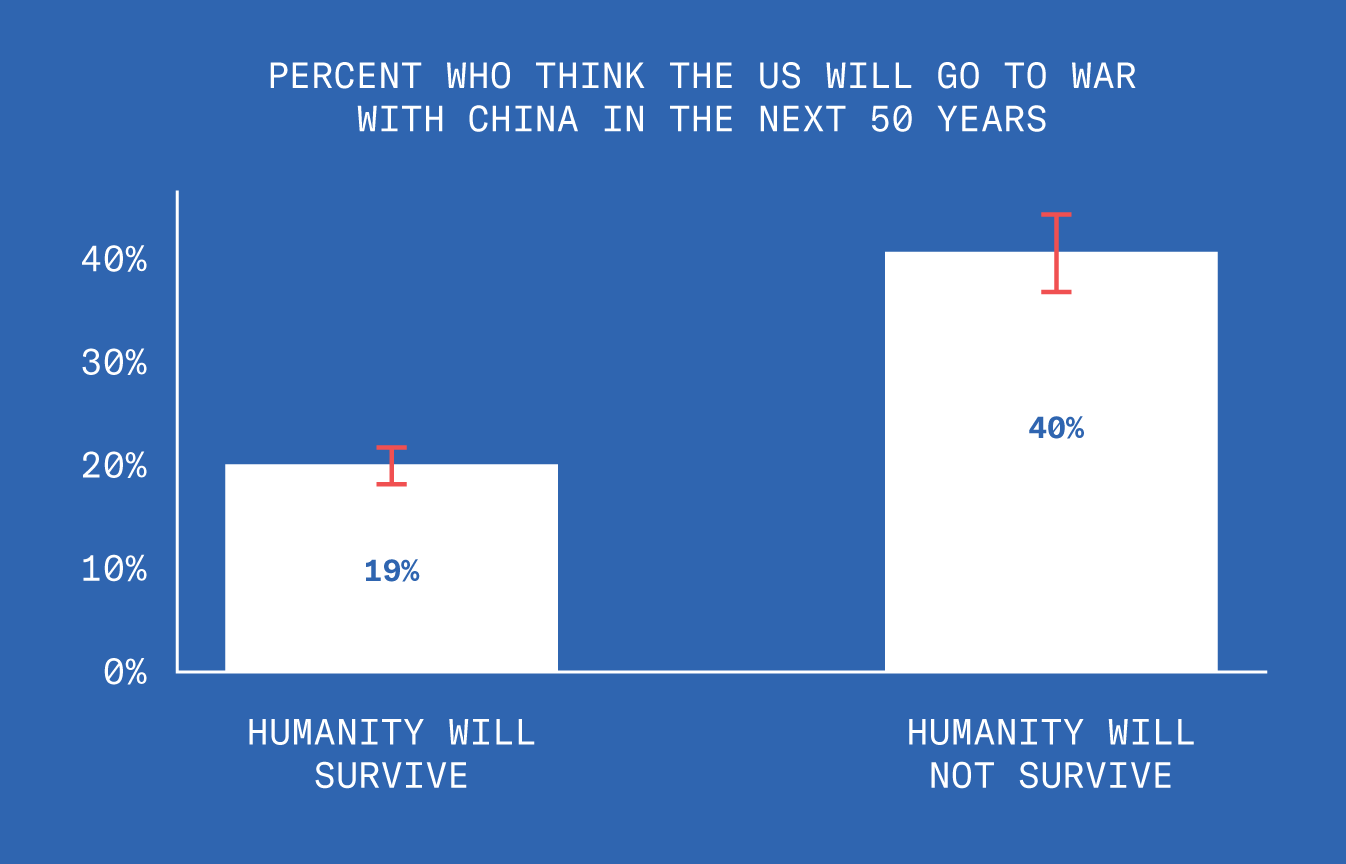
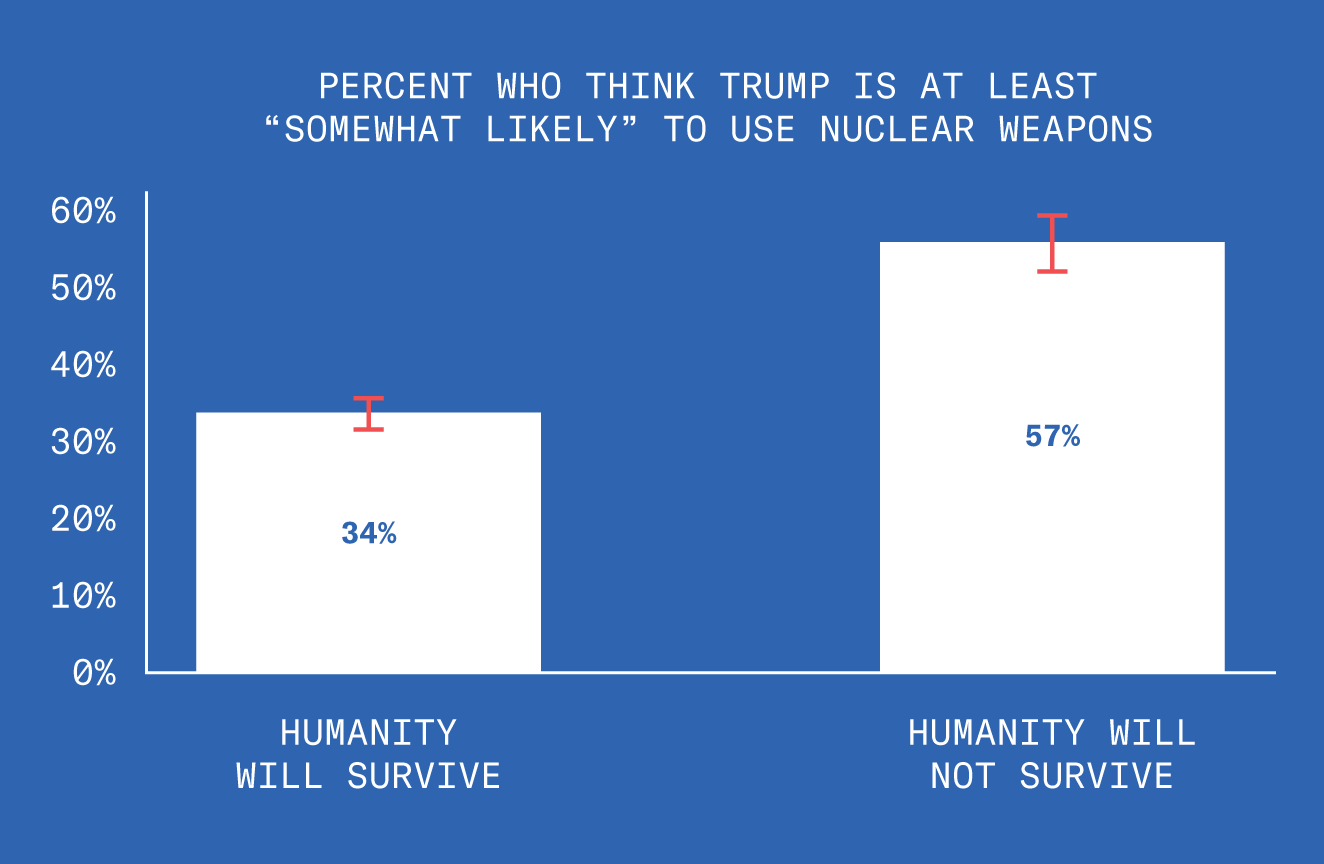
Turns out the pessimists have some specific concerns in mind: people who doubt that humanity will survive the next century are more likely to believe a war with China is on the horizon, and that Trump will use a nuclear weapon during his time in office.
The Future of Humanity – 4 of 5
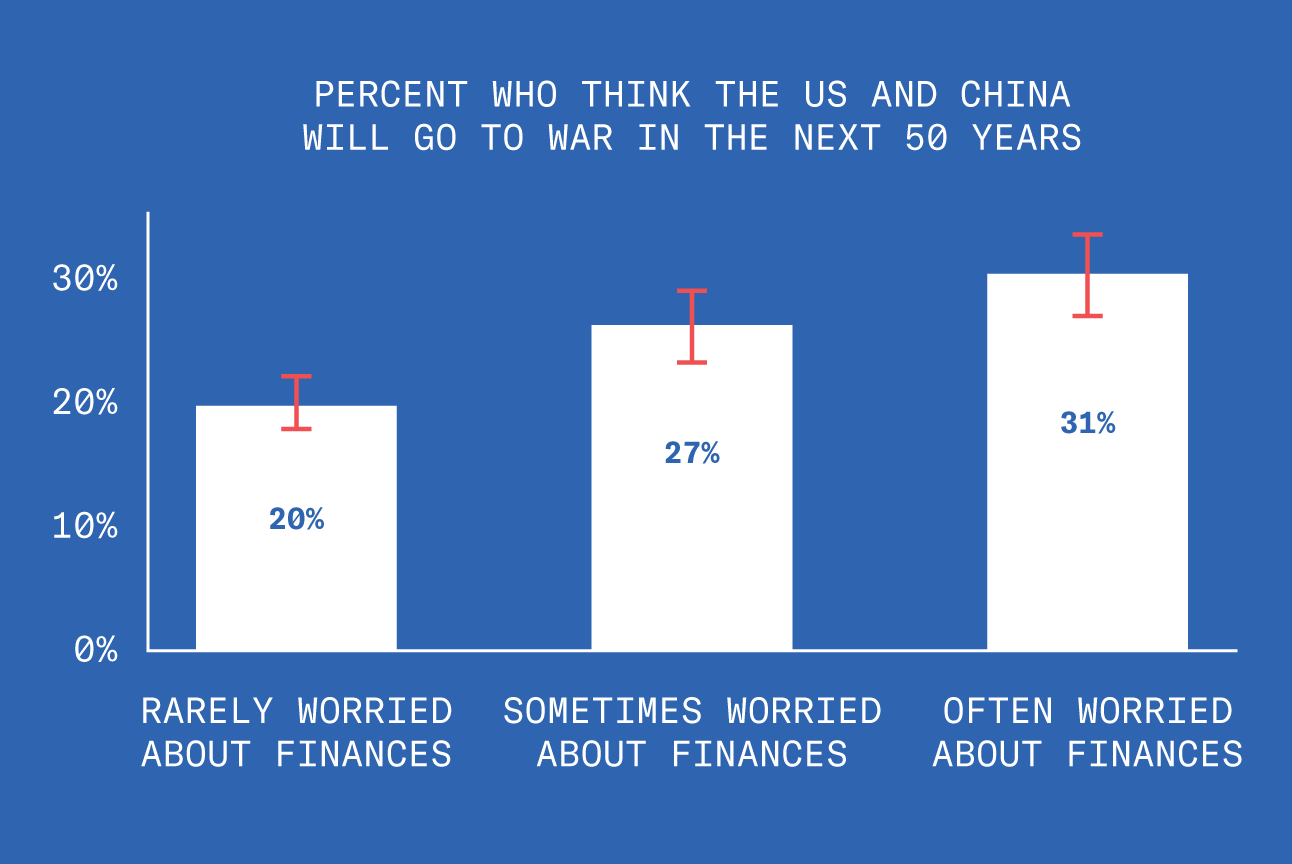
People who are more worried about their personal finances are more worried about the world in general. They’re more likely to think America will go to war with China, that Donald Trump will use a nuclear weapon during his time in office, and that humanity will go extinct in the next hundred years.

The Future of Humanity – 5 of 5

The Future of America
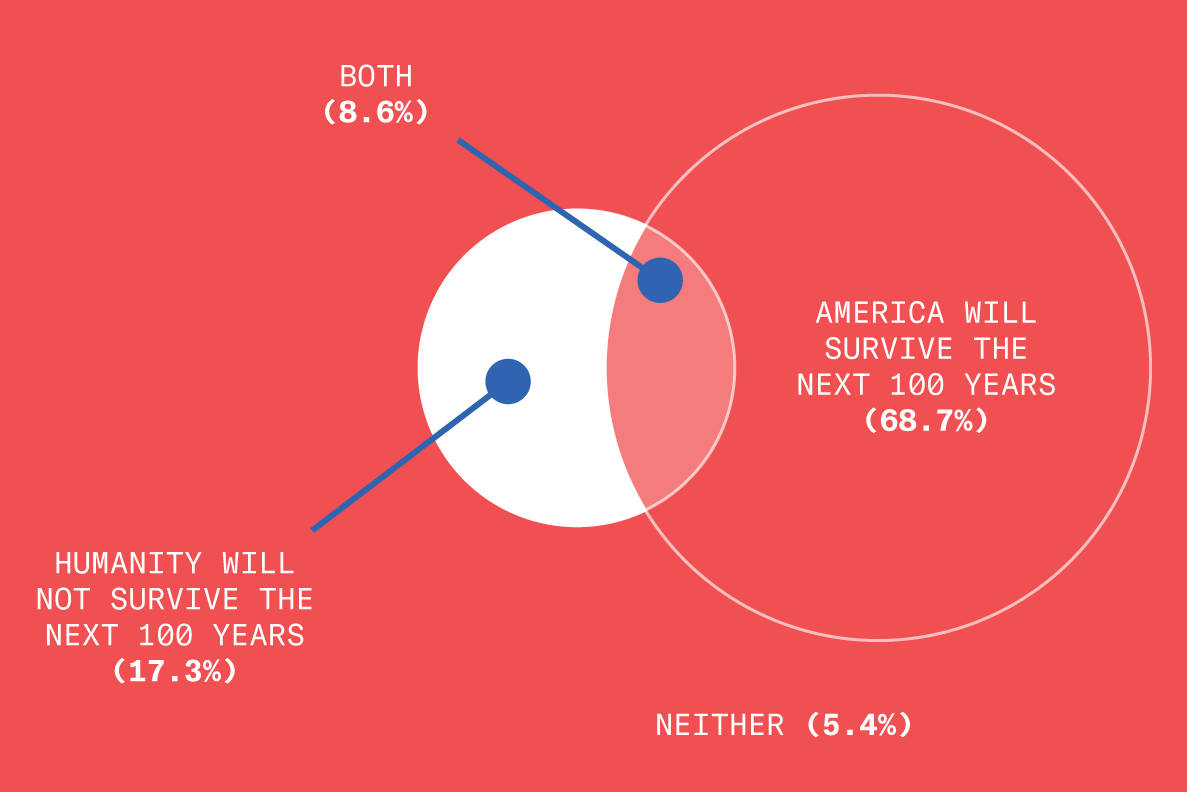
Next, we asked people if they thought America, as opposed to humanity, would survive the next hundred years. Again, most people were optimistic.
The Future of America – 2 of 3
Were there any patriotic idiots who said that humanity would go extinct but that America would somehow make it? Yes, almost a third of the people who thought humanity would perish thought that America would survive. They must really believe in America.
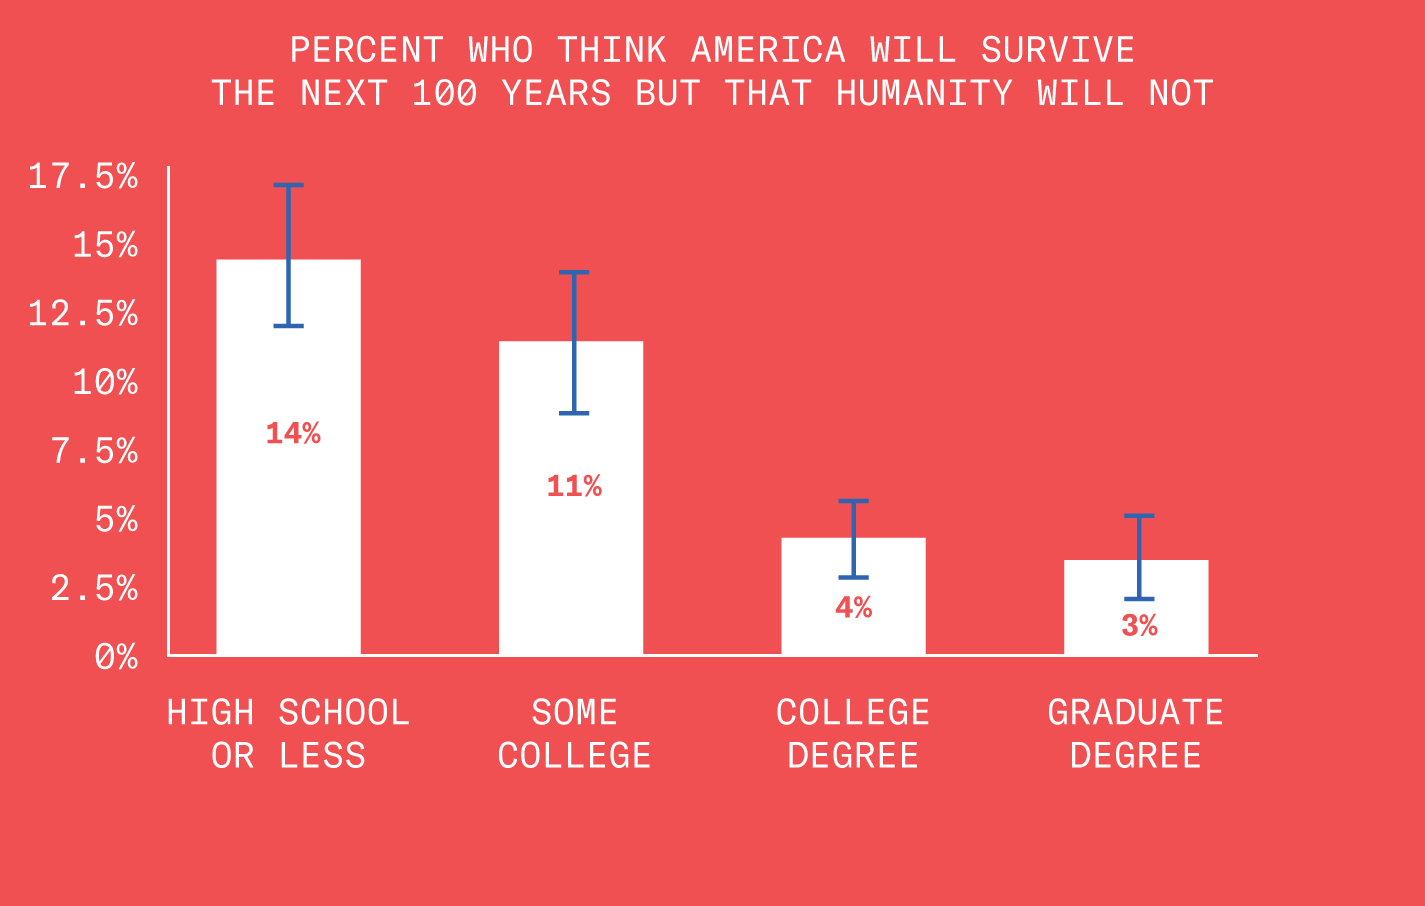
The Future of America – 3 of 3
Perhaps unsurprisingly, the more educated you are, the more likely you are to realize that “America” is a subset of “humanity.”
Well, that’s all we got for this year. America has been saved, even if humanity was already doomed. This concludes Cards Against Humanity’s Pulse of the Nation. I love you.
The Common Good
In these divisive times, it brings us comfort to believe that deep down, most Americans are patriots who can set aside partisan differences and put the best interests of our country first. Just to be sure, we asked people a bunch of trick questions to see if this was actually the case.

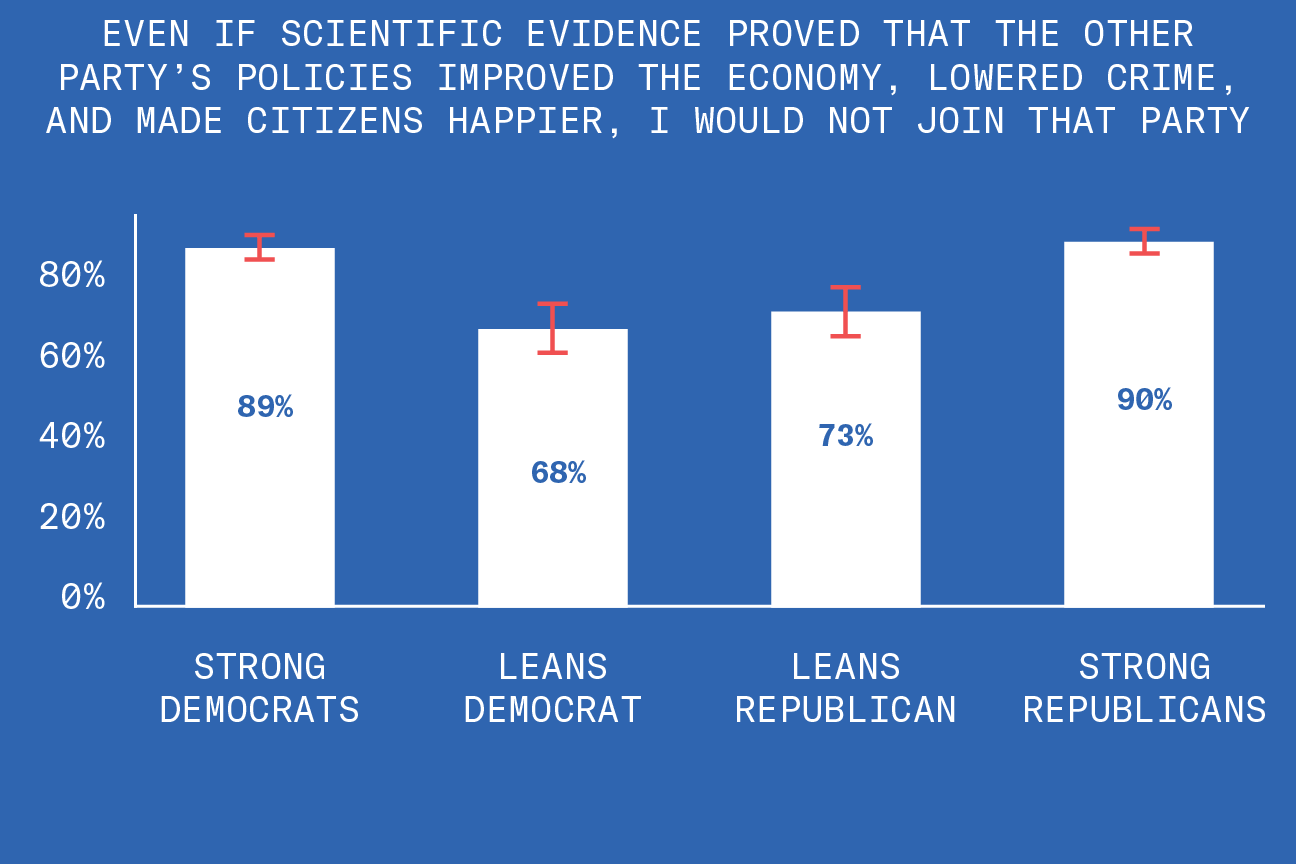
Even if their policies were scientifically proven not to work, Democrats would rather stick with them than agree with Republicans. This statistic would look great on a sign at one of those marches for science.
The Common Good – 2 of 3
Now let’s have a look at the Republicans.

Perhaps not surprisingly, Republicans would also not be swayed by studies showing their policies don’t work. Democrats should probably stop using this exact strategy to win elections.
The Common Good – 3 of 3
People who strongly identified with their political party had the most damaged brains and were least likely to change their minds based on evidence.
It turns out that politics is a competition over power and resources, and not a witty exchange of facts and banter like on The West Wing.
Respect My Authority
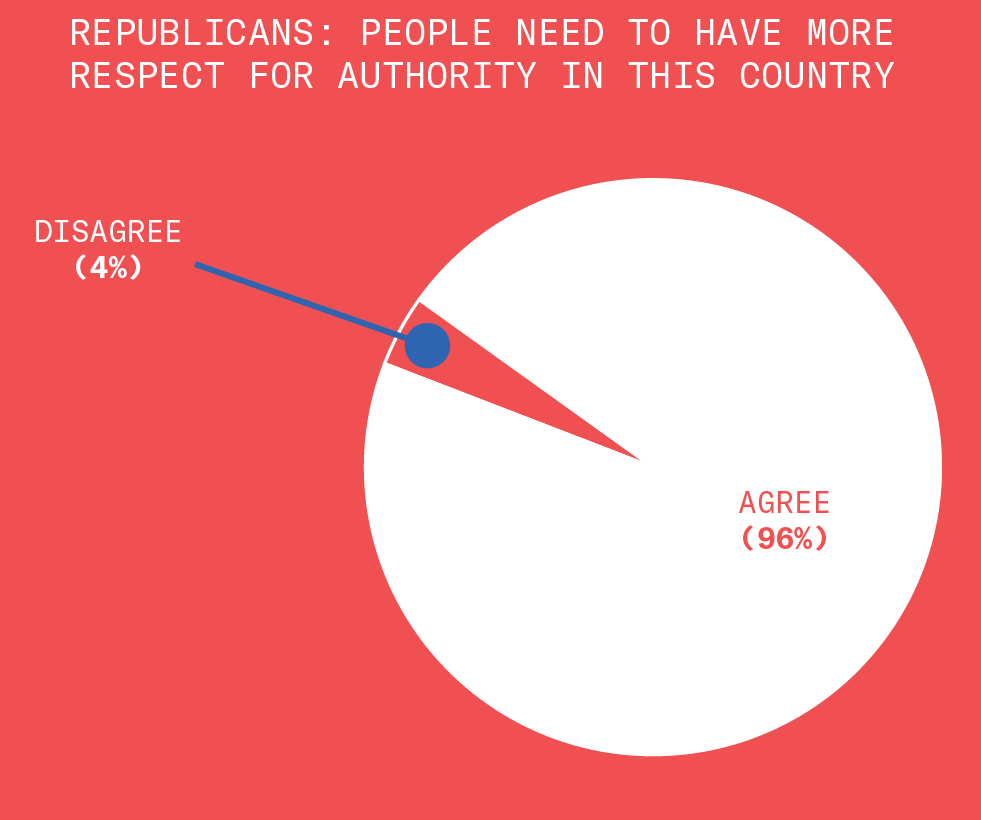
One of Donald Trump’s big themes is that people should know their place: NFL players shouldn’t kneel, and cable news should respect the president. When we asked, pretty much all Republicans said they agree with the statement: “People need to have more respect for authority in this country.”
Respect My Authority – 2 of 3
But when it comes time for businesses to respect the authority of the federal government… not so much.
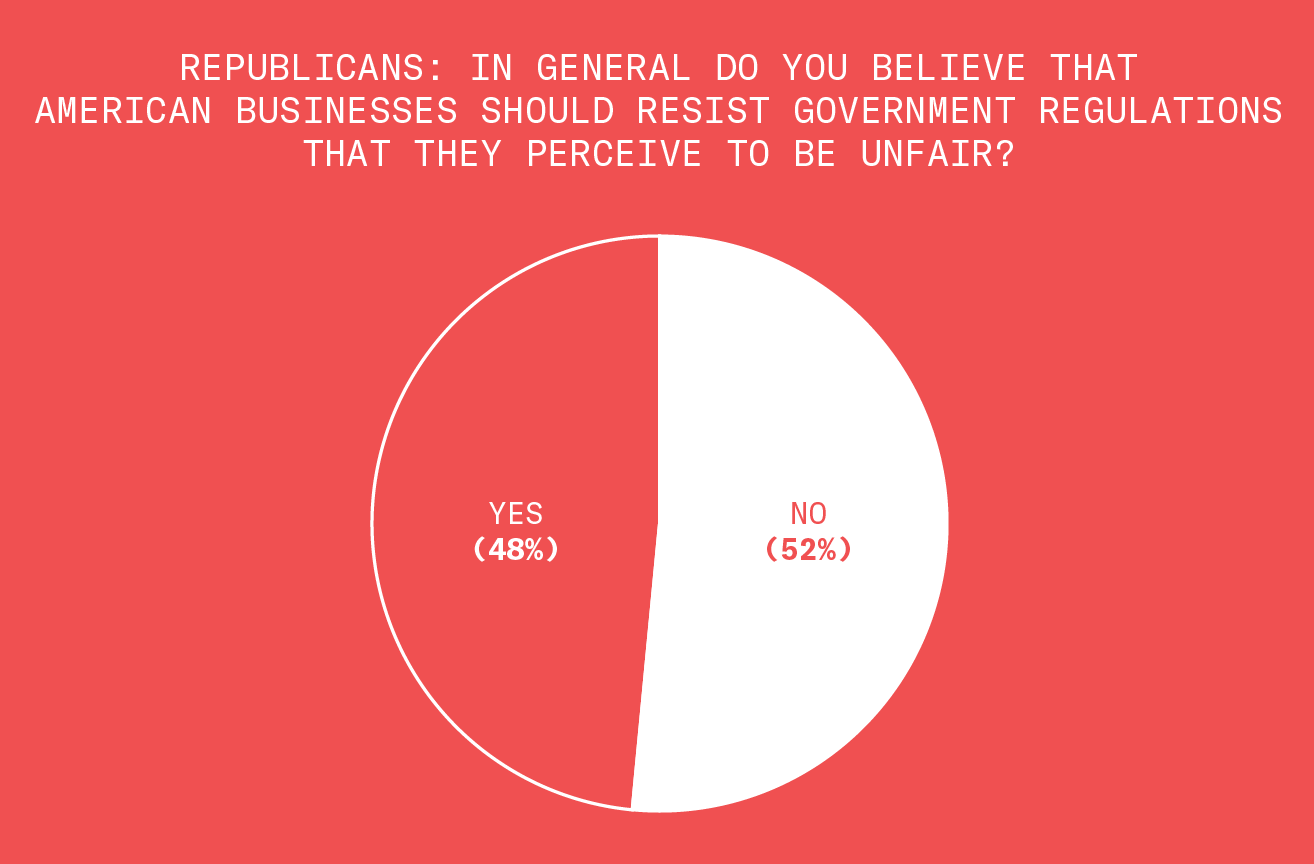
Respect My Authority – 3 of 3
About half of Republicans managed to believe both of these things at the same time.
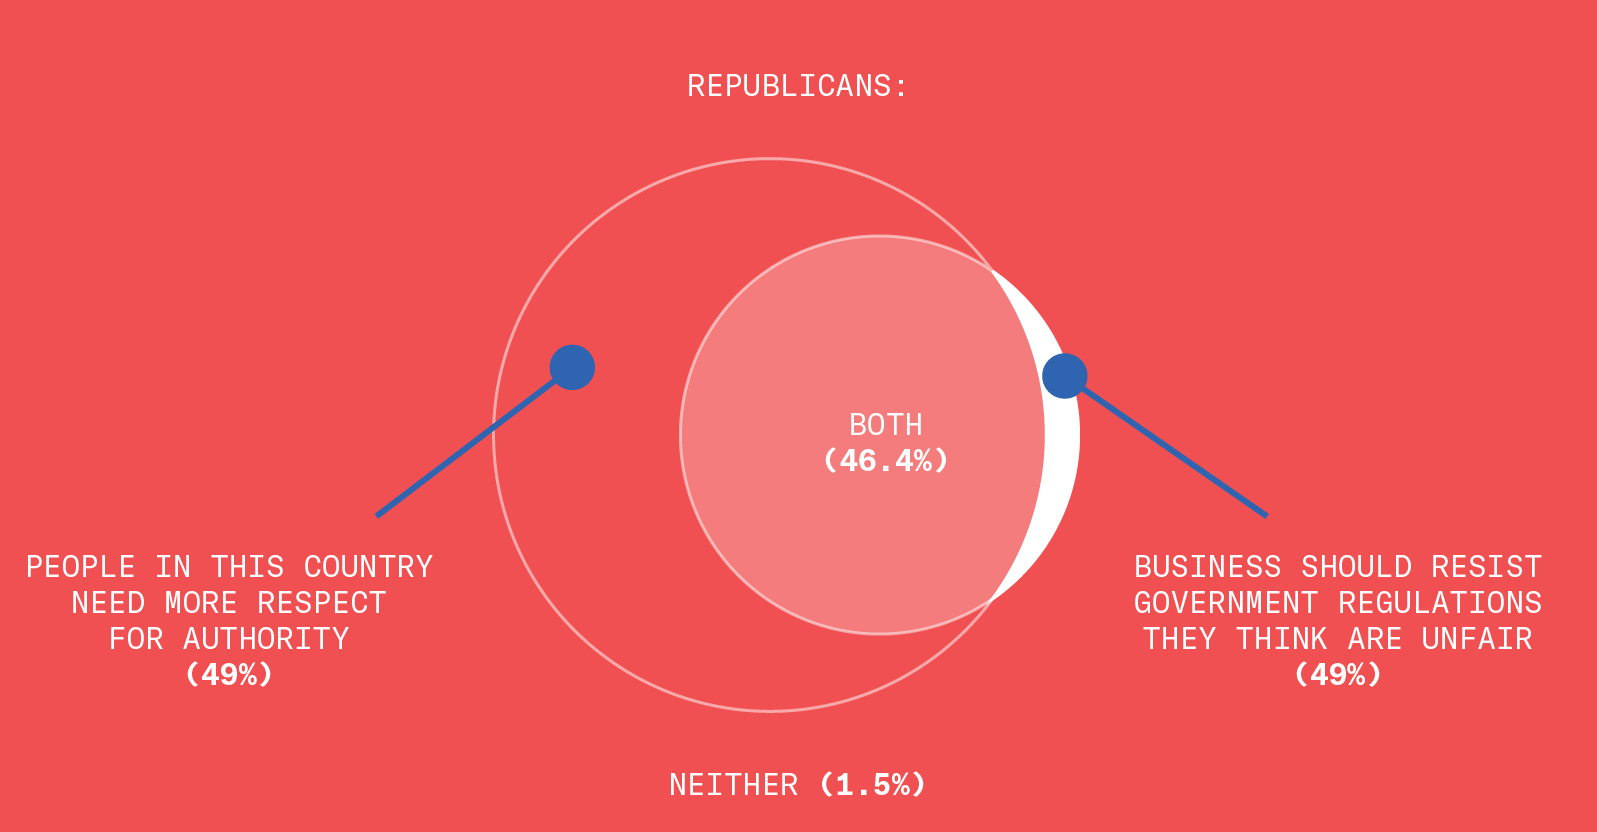
It turns out Republicans mostly respect the authority of the people they agree with. Which of course we do too. The people we agree with are awesome.
Stereotypes
Is it wrong to believe a negative stereotype about a group of people based on where they were born? Most Democrats say yes.

Stereotypes – 2 of 3
But nearly half of Democrats think that if you’re born in “the American south,” you are “more racist than people from other parts of the country.”
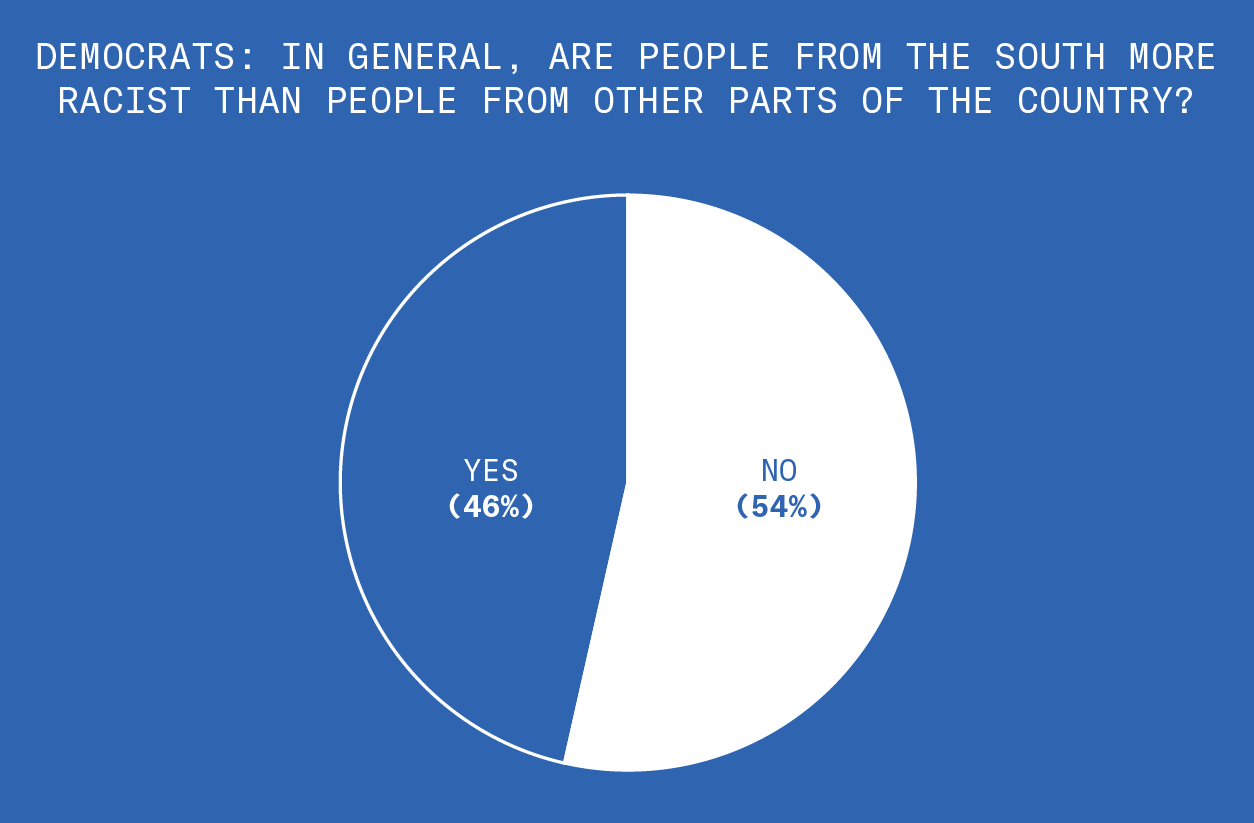
Stereotypes – 3 of 3
As you might have expected, there’s quite a bit of overlap - the same people who believe that stereotypes are wrong hold negative stereotypes of Southerners.
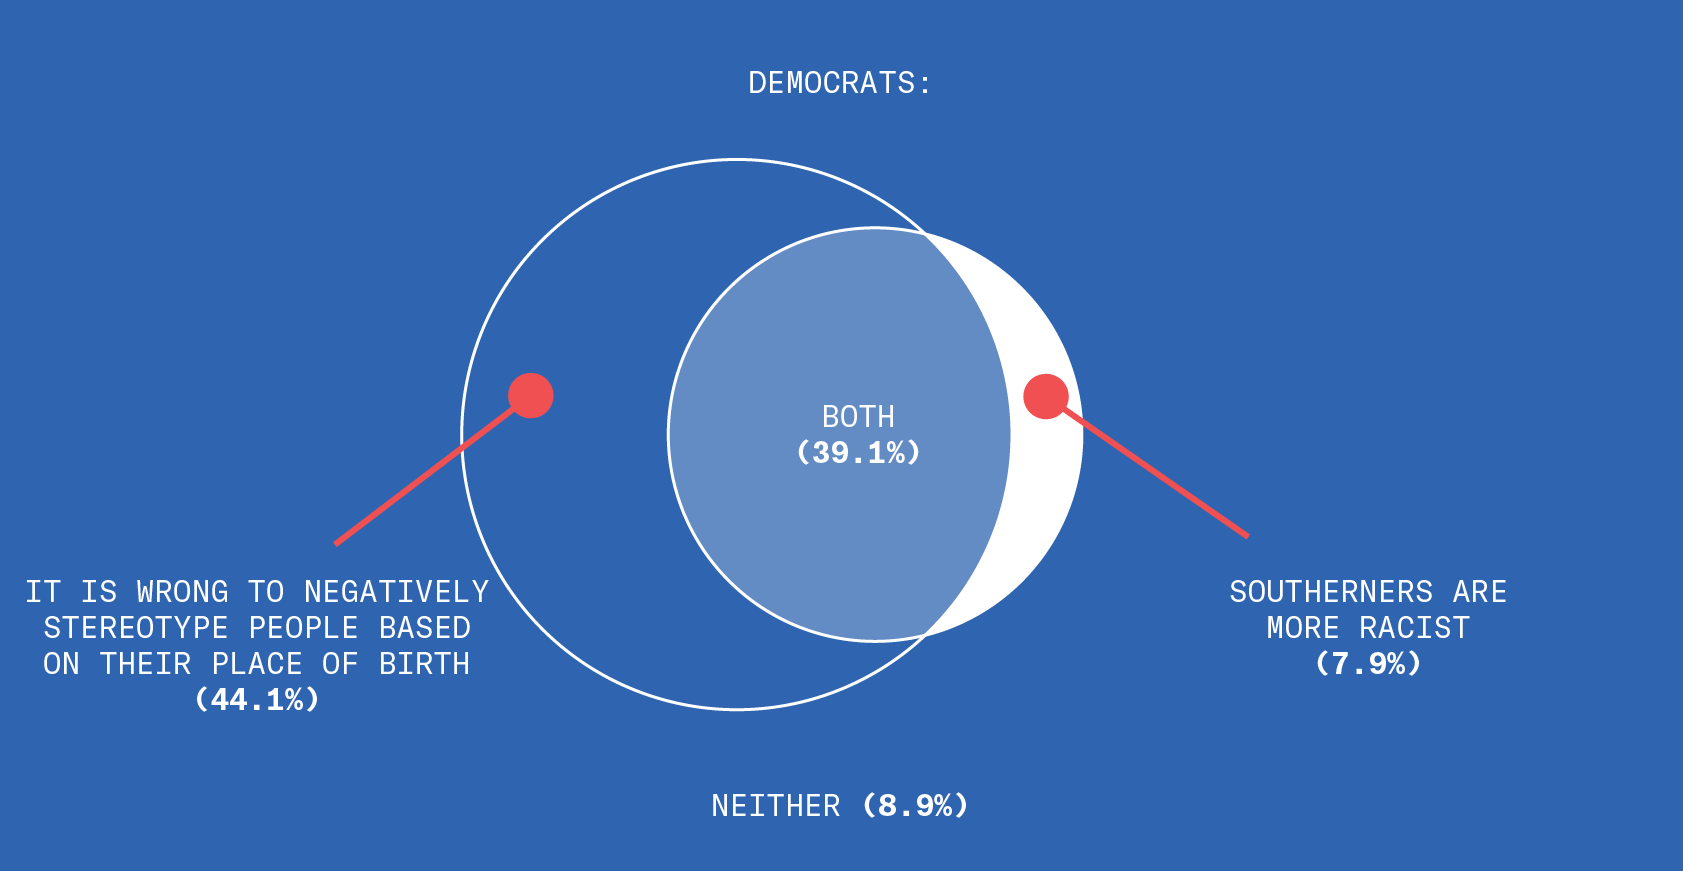
Just like everyone else, Democrats are mostly okay with stereotypes about people they don’t like. And let’s be honest - the people we don’t like are dumb racist assholes.
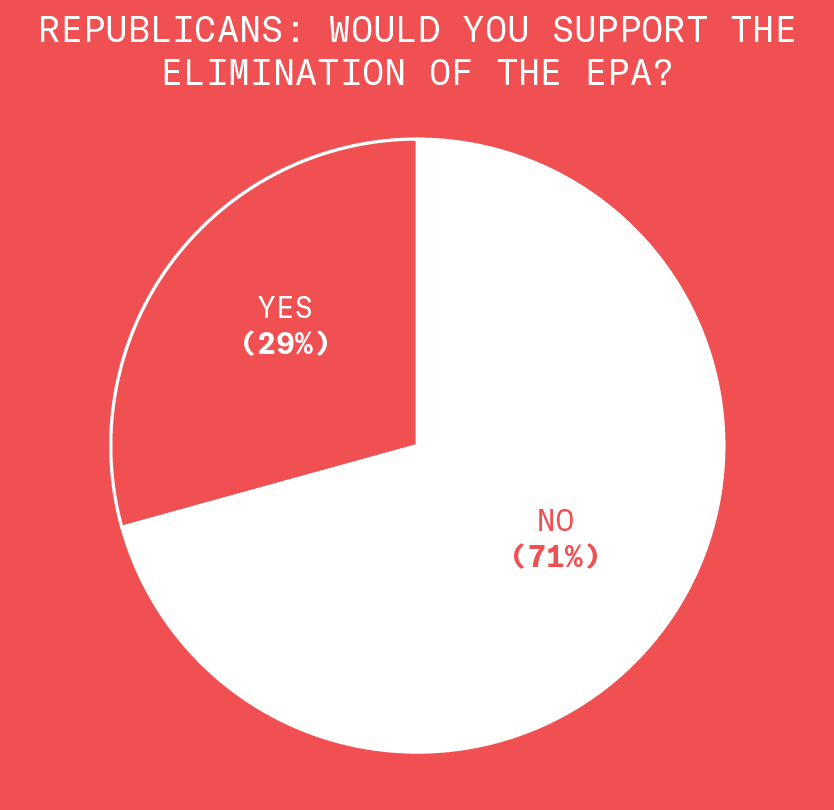
The Environment
The Environmental Protection Agency (EPA) was established by Richard Nixon in 1970. Most of their staff are engineers and scientists, and they have a budget of about $8 billion each year to protect our clean air and water. But if you watch the Republican debates, you might see many candidates say they want to abolish the EPA. In fact, one in three Republicans we asked would support eliminating the EPA.
The Environment – 2 of 5
Yet of the Republicans who want to eliminate the EPA, the vast majority believe that the government should ensure that Americans have access to clean air and drinking water.
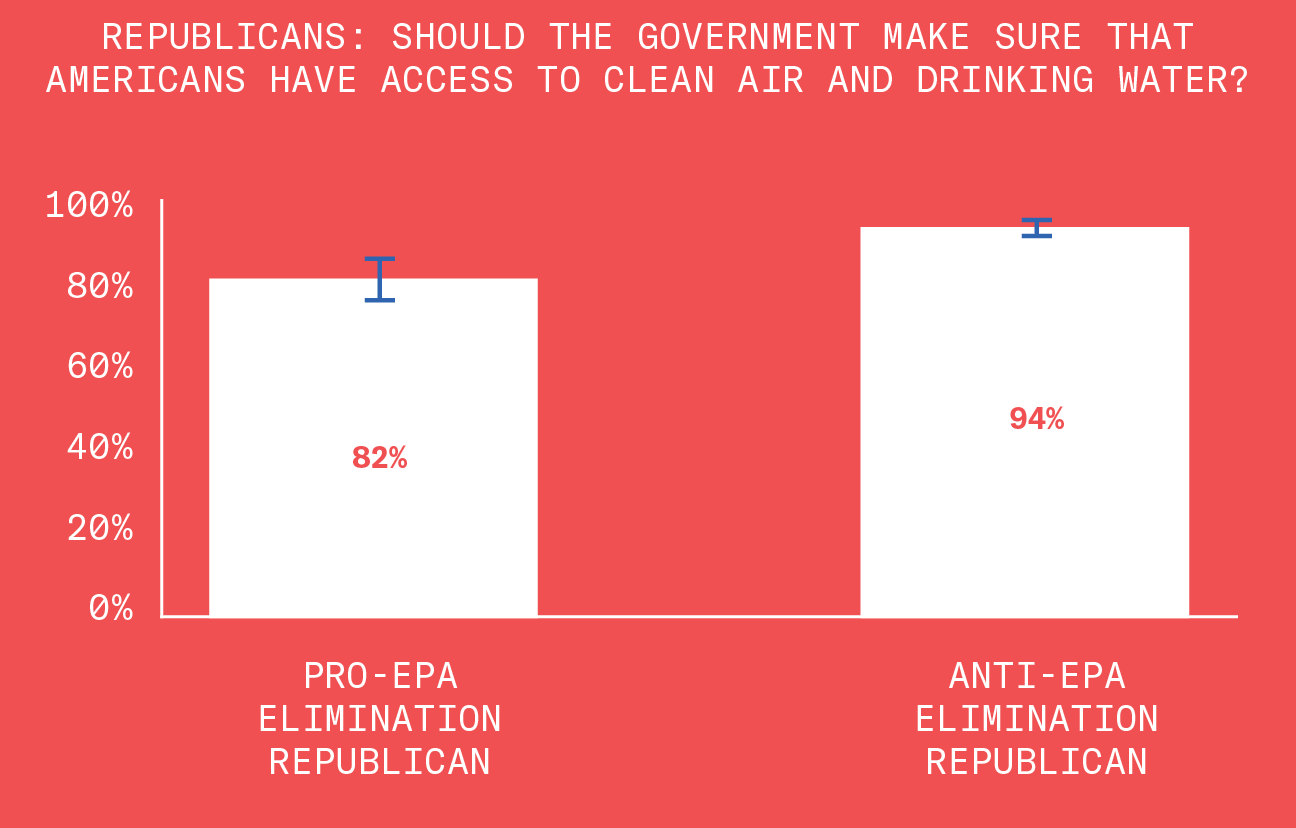
Maybe they favor an alternate plan, like everyone switching over to Trump Water™ and Trump Air™.
The Environment – 3 of 5
We all know that Republicans are misinformed about environmental policy. But most Democrats are very confident in their own information.
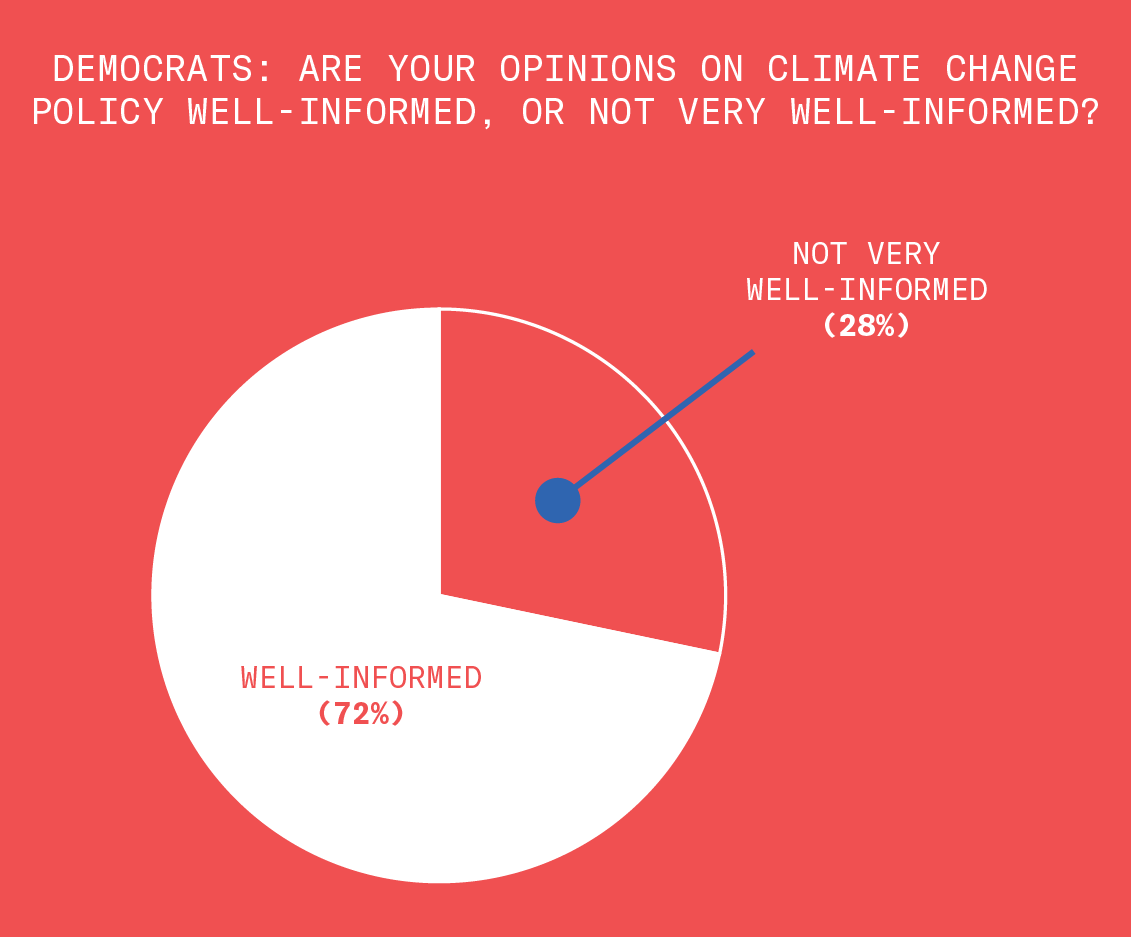
The Environment – 4 of 5
You can probably see where this is going. When we asked Democrats if nuclear power plants produce carbon emissions that contribute to climate change, 65% said they do, which is incorrect.
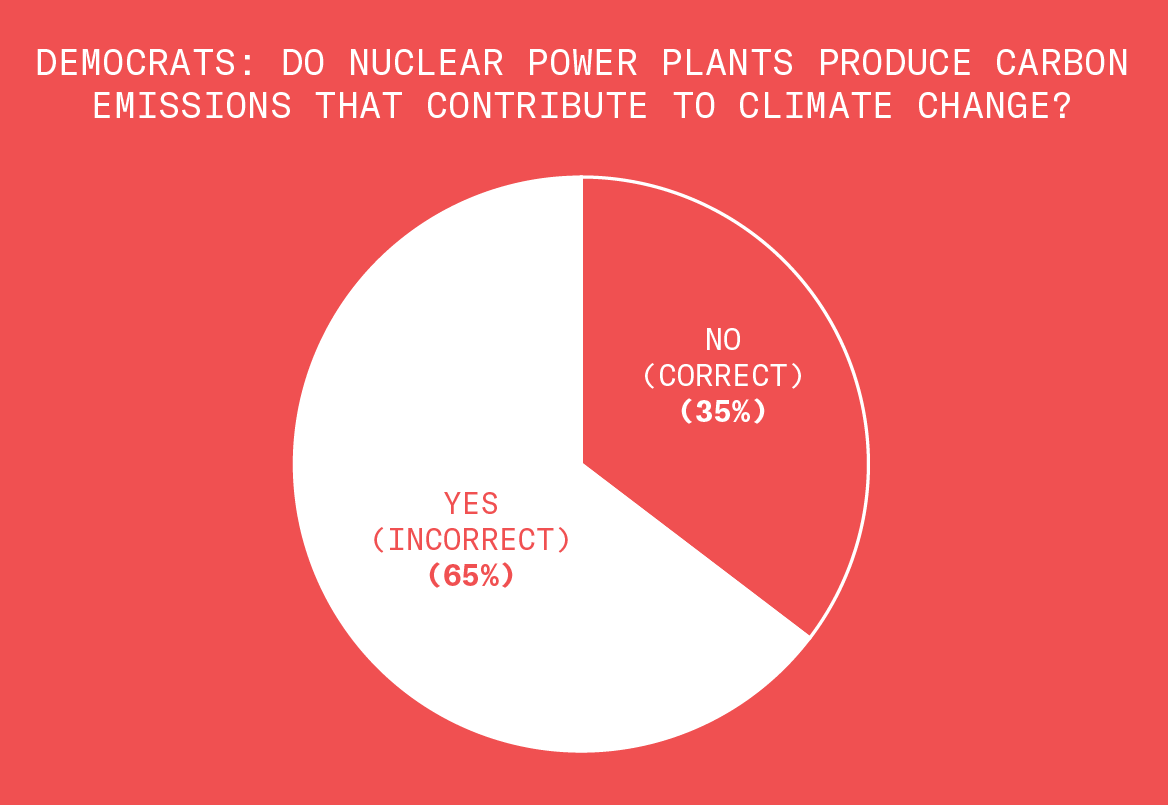
The Environment – 5 of 5
Of course the same people who think they are well-informed are, in fact, not well-informed.

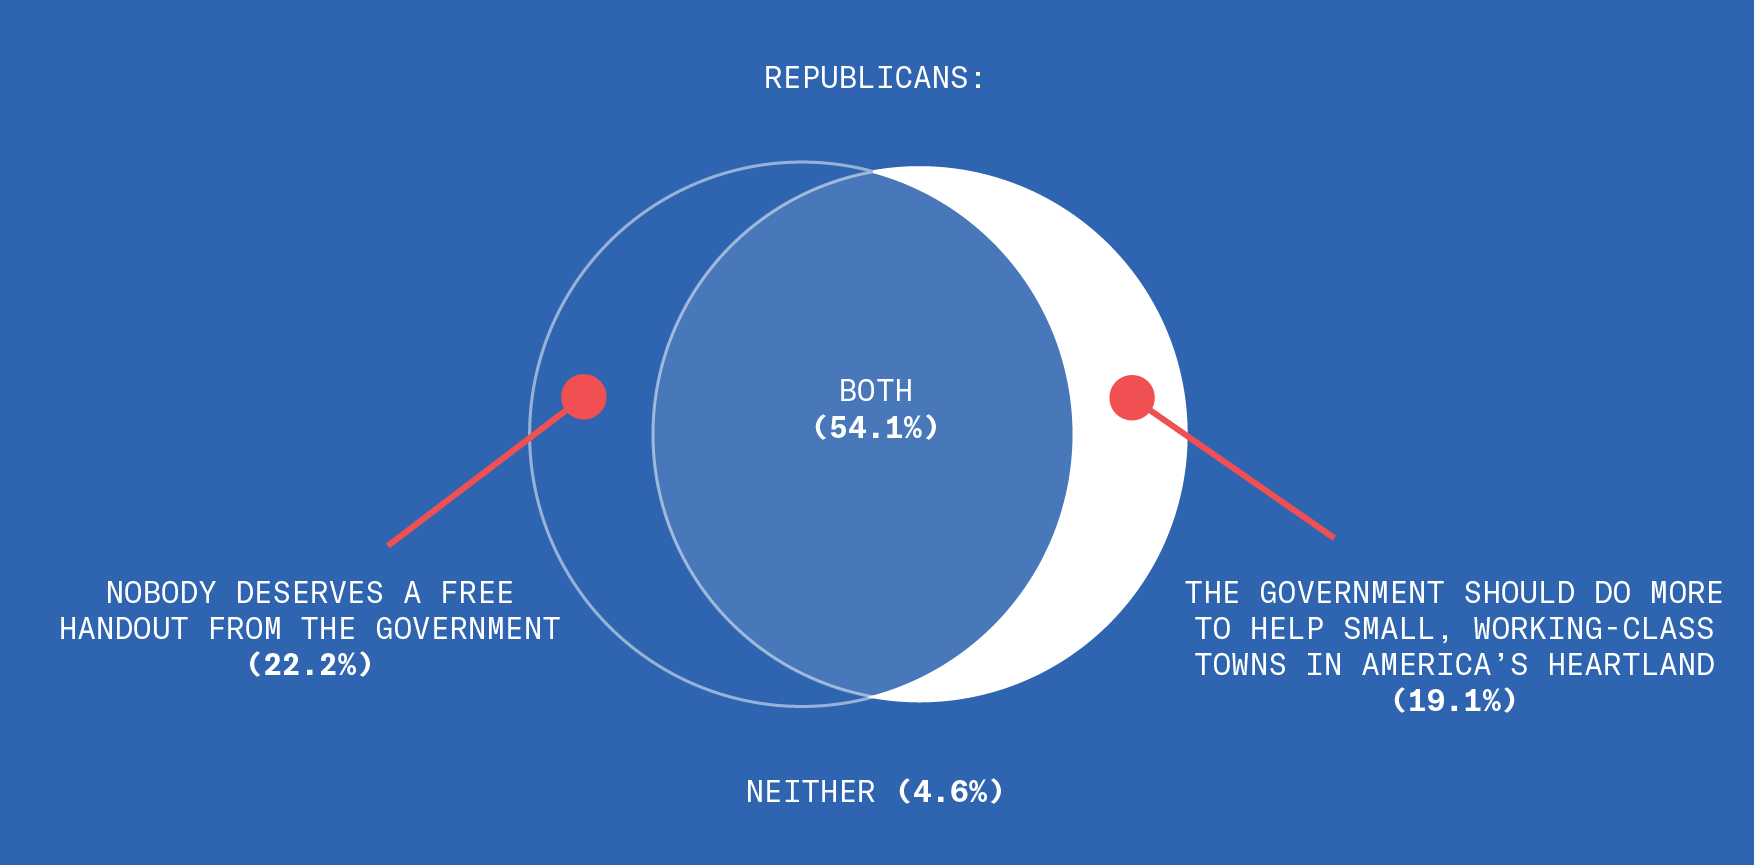
Government Handouts
According to 77% of the Republicans we asked, nobody deserves a free handout from the government.
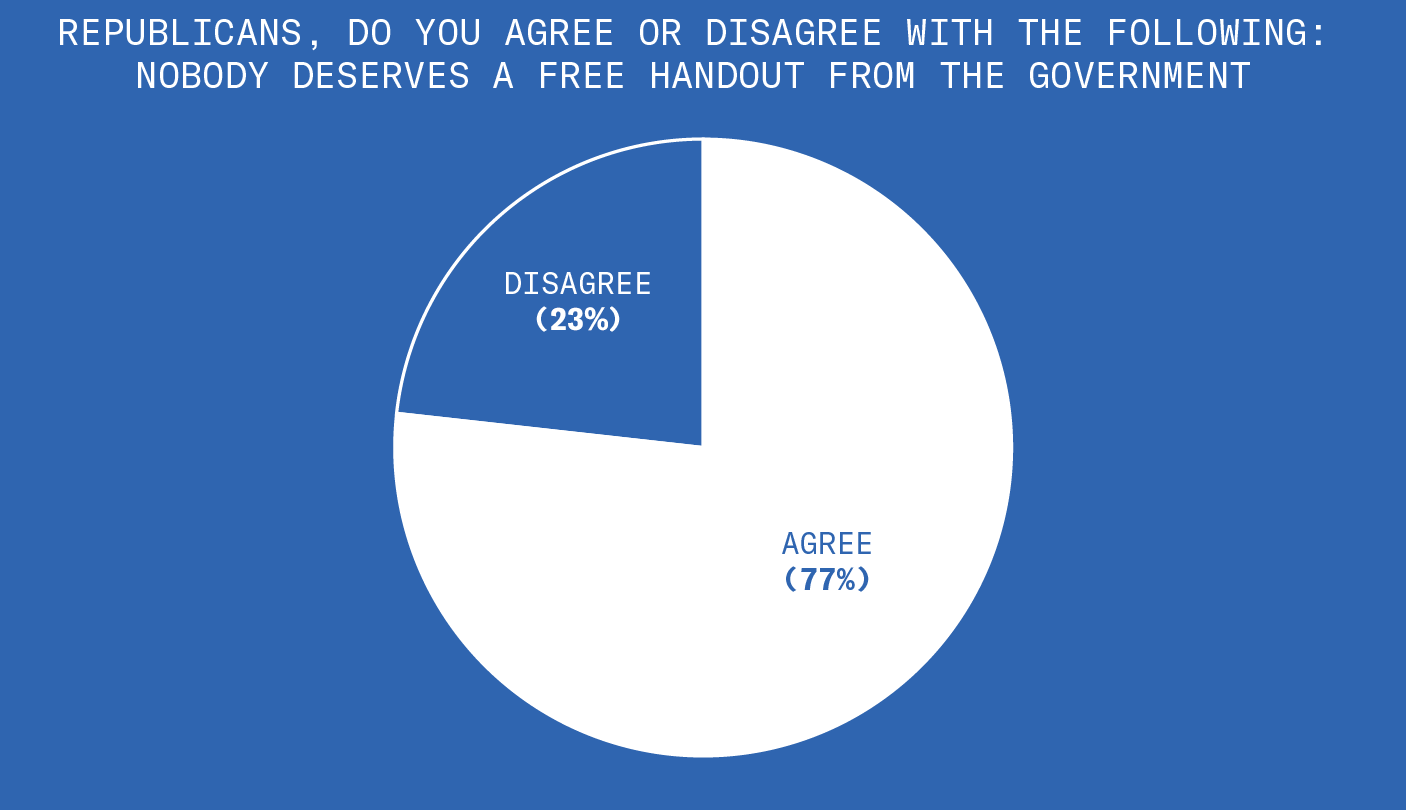
Government Handouts – 2 of 3
Yet most Republicans also believe the government needs to do more to help “small, working class towns in America’s heartland.”
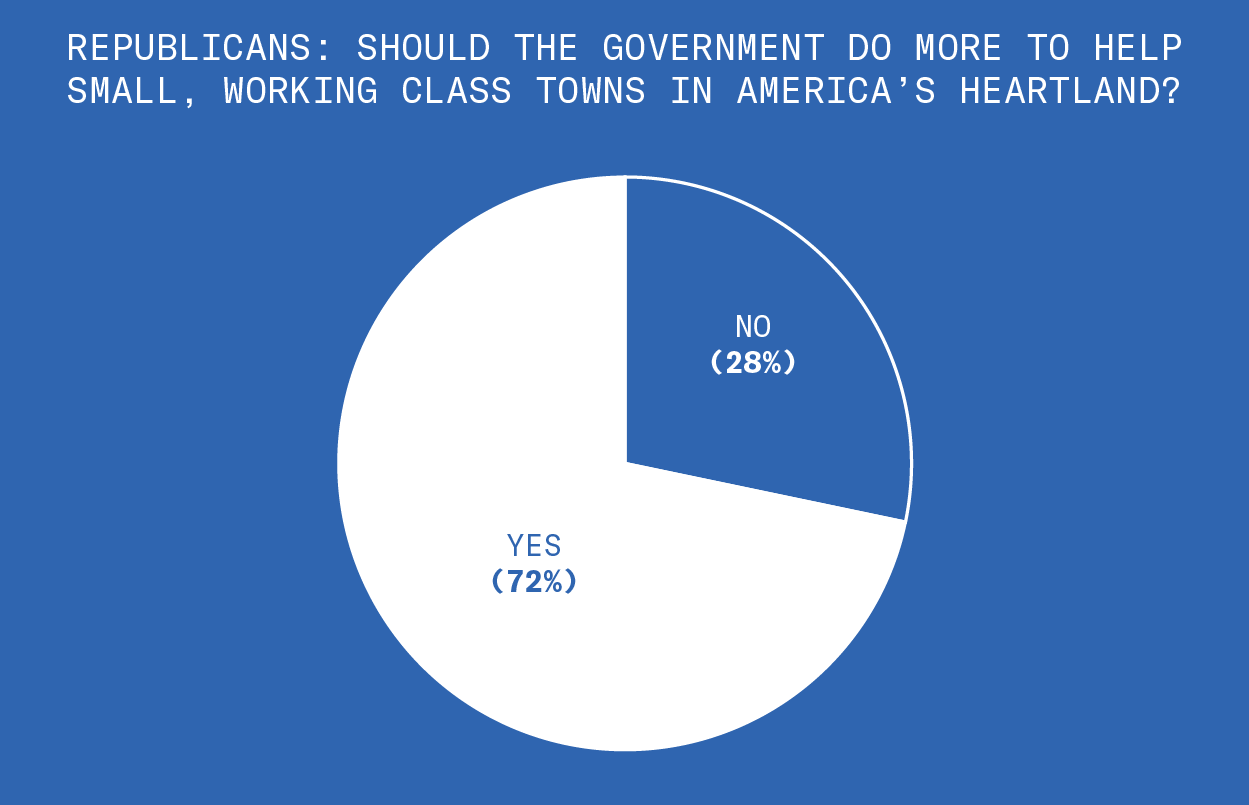
Government Handouts – 3 of 3
You can decide for yourself how racist this is. (We give it an 8/10 on the Cards Against Humanity Racism Index.)
Redistribution
Do you support redistribution of wealth? It turns out your answer is largely determined by how much of your wealth would be redistributed.

Redistribution – 2 of 2
People also support redistribution because they think it will benefit most of the people they know.
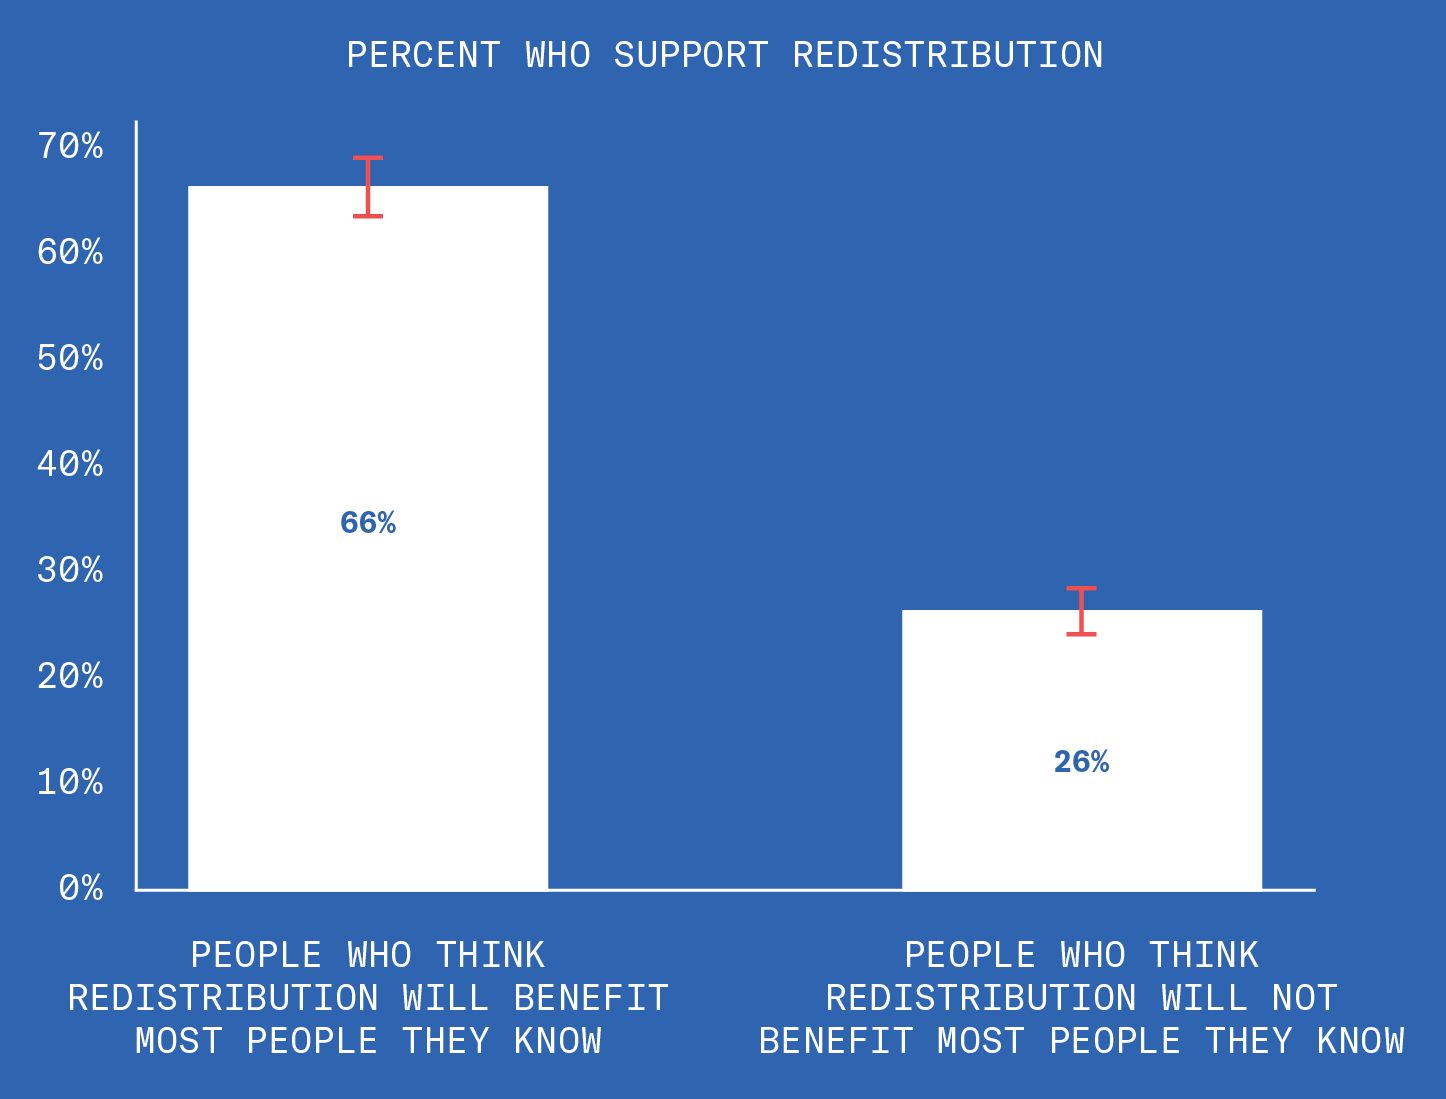
Turns out poor people and their friends want money, and rich people and their friends want to keep their money. The good news is that there’s a lot more poor people than rich people. The bad news is we don’t live in a democracy.
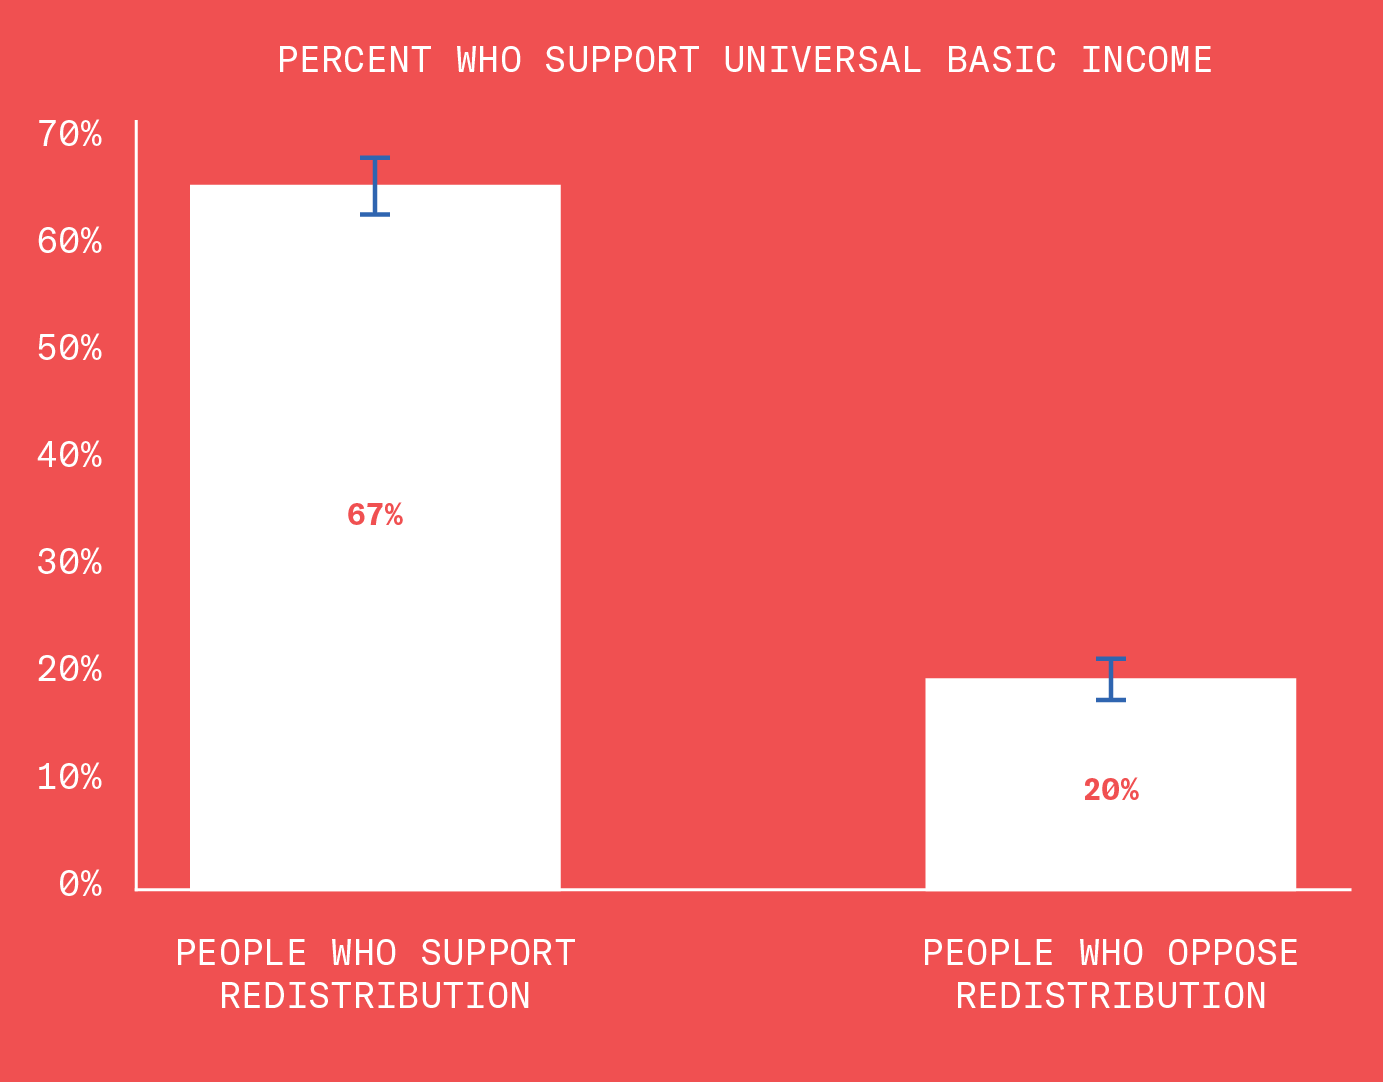
Basic Income
Most Americans don’t support a universal basic income.

Basic Income – 2 of 3
That’s probably because people think of “universal basic income” as a pretentious way of saying “redistribution of wealth.”
Basic Income – 3 of 3
People are more likely to support a basic income if they think they’re being paid unfairly by their employer.
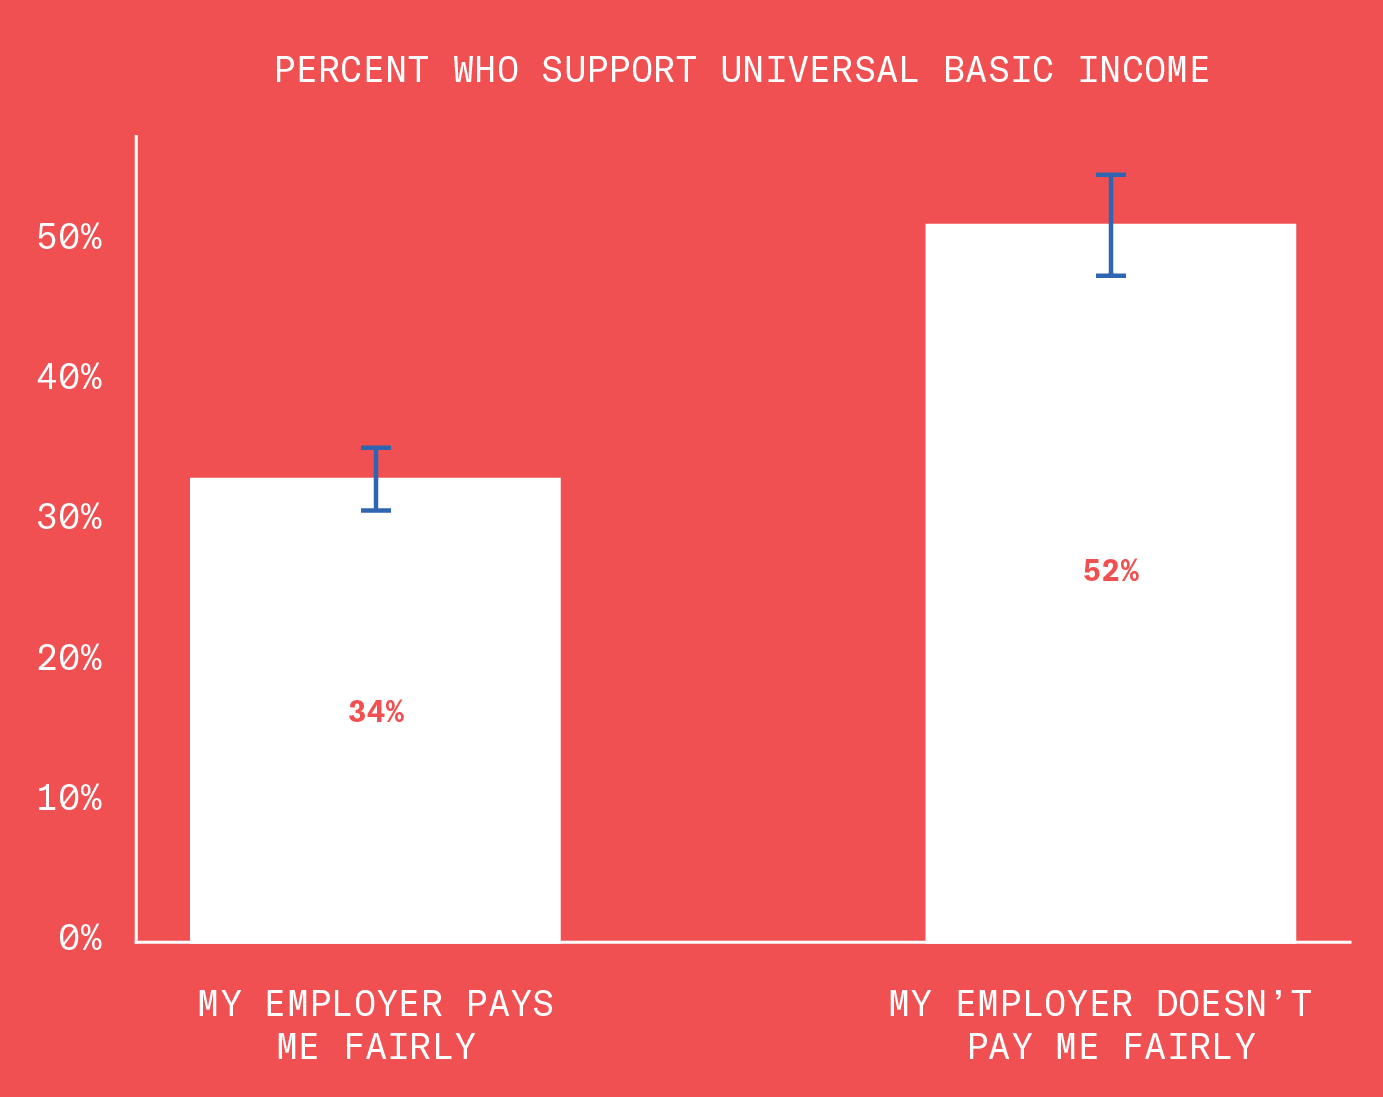
Turns out if you’re getting fucked by the system, you’re more interested in unfucking the system.
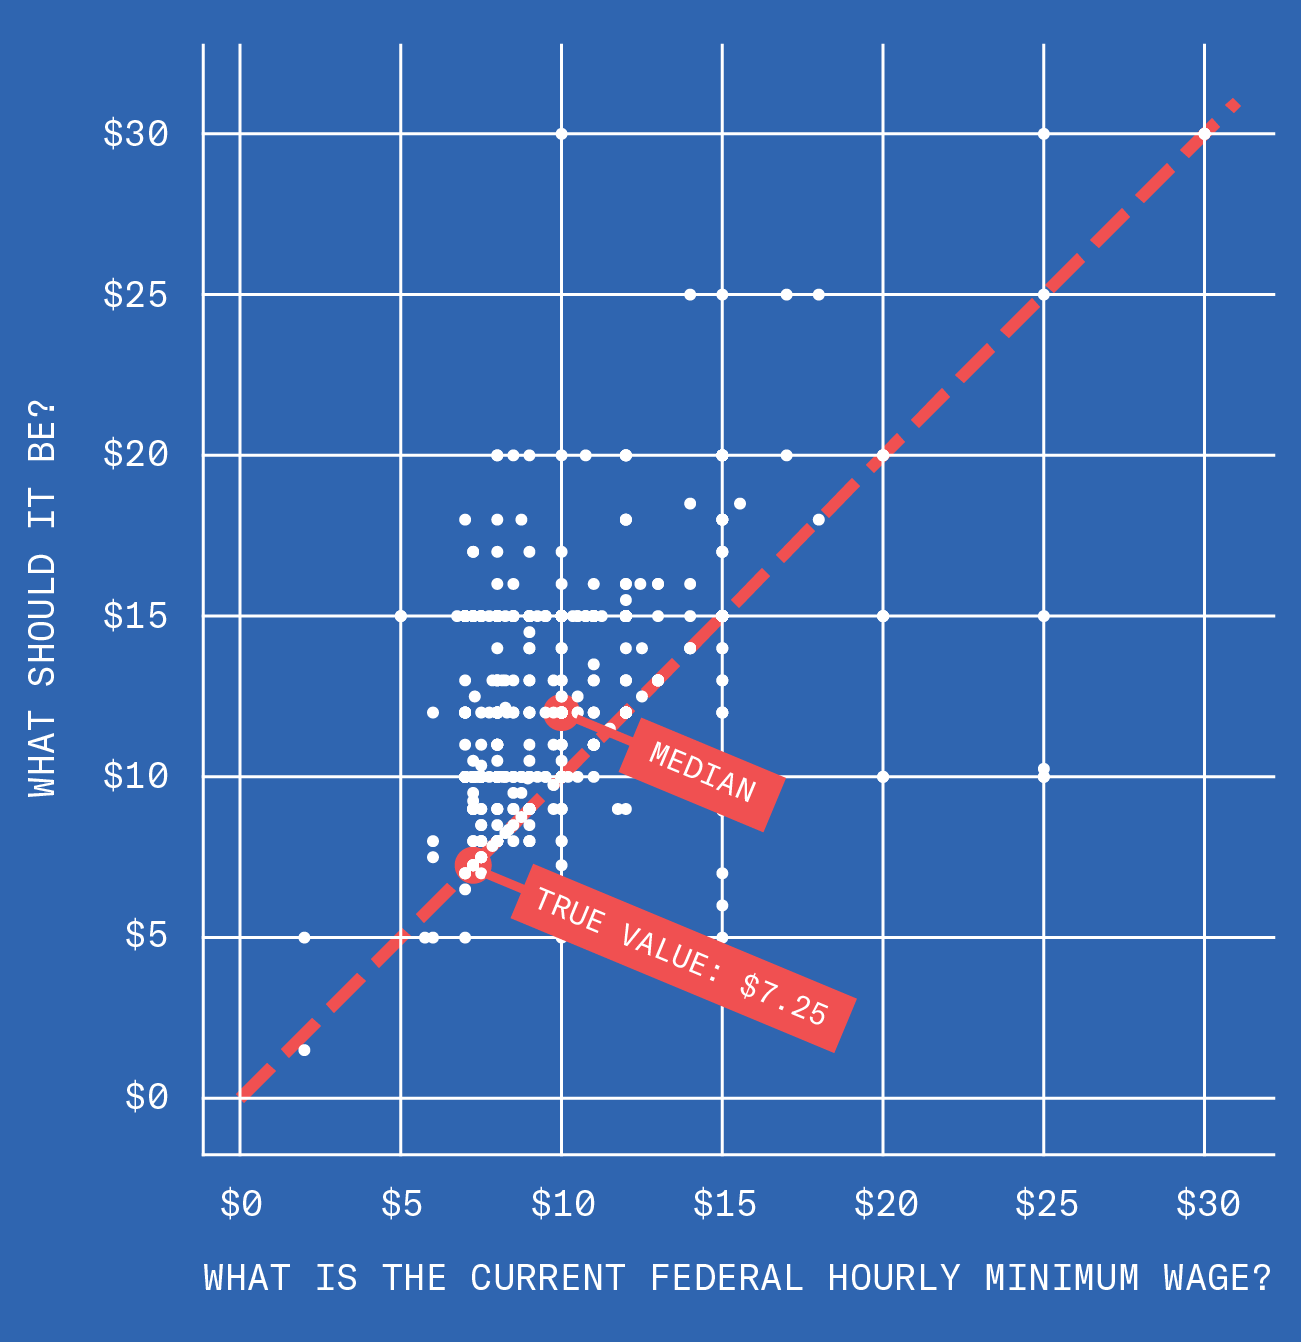
Minimums and Maximums
We asked people to guess the federal minimum wage, and then to say what they think the minimum wage should be. Most people, regardless of ideology, overestimate the minimum wage, and still think it’s too low.
Minimums and Maximums – 2 of 3
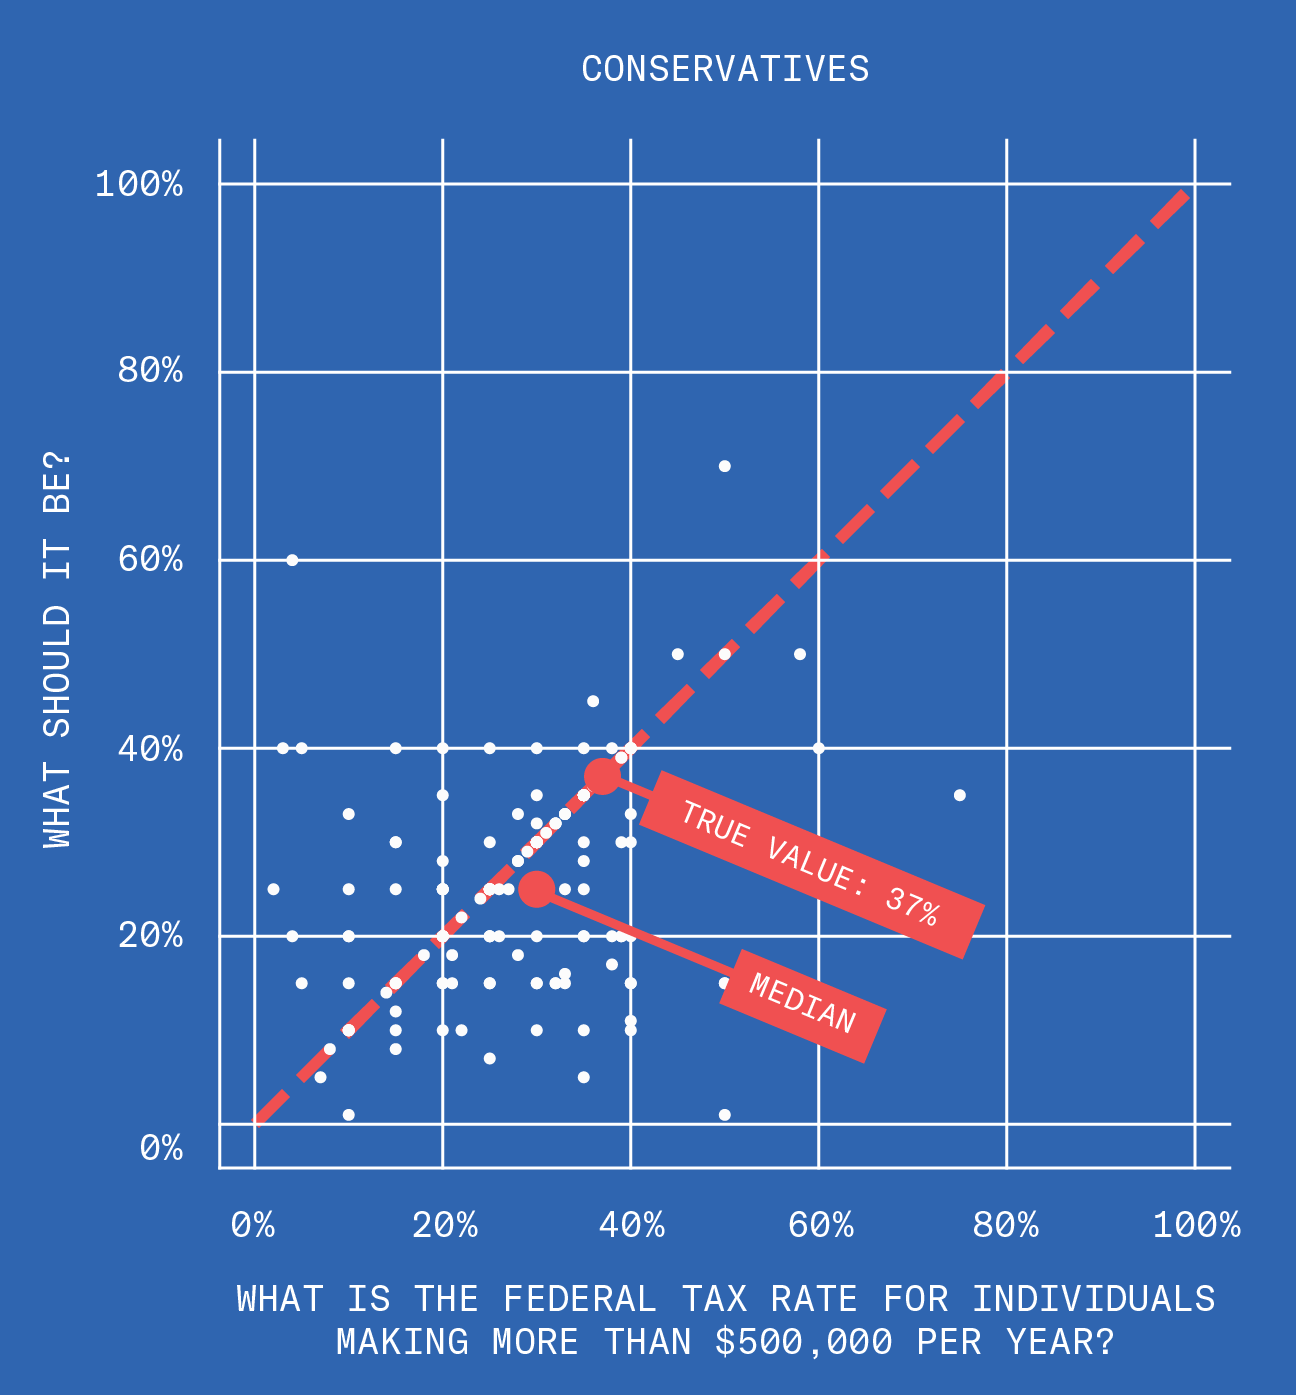
We then asked people to guess the federal tax rate for individuals making more than $500,000 a year, and then to say what they think that rate should be. Liberals want the top tax rate to be higher than they think it is, but embarrassingly, not as high as it actually is.

Minimums and Maximums – 3 of 3
Conservatives also underestimate the tax rate for rich people, but unlike liberals, they think it should be even lower.
Fairness
Most people think it is unfair that the average CEO makes 16 million dollars per year.
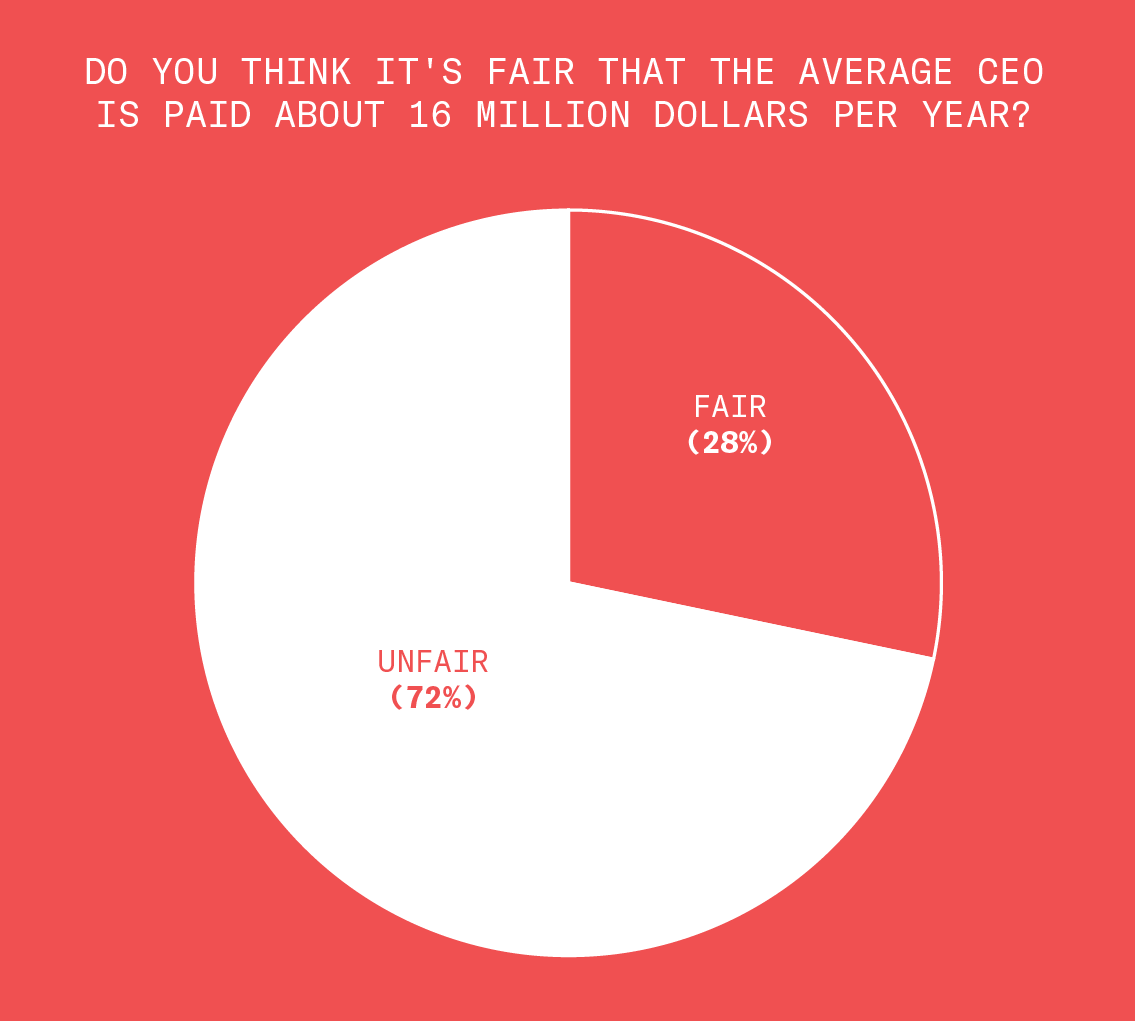
Fairness – 2 of 5
Even a majority of conservatives think this is unfair.
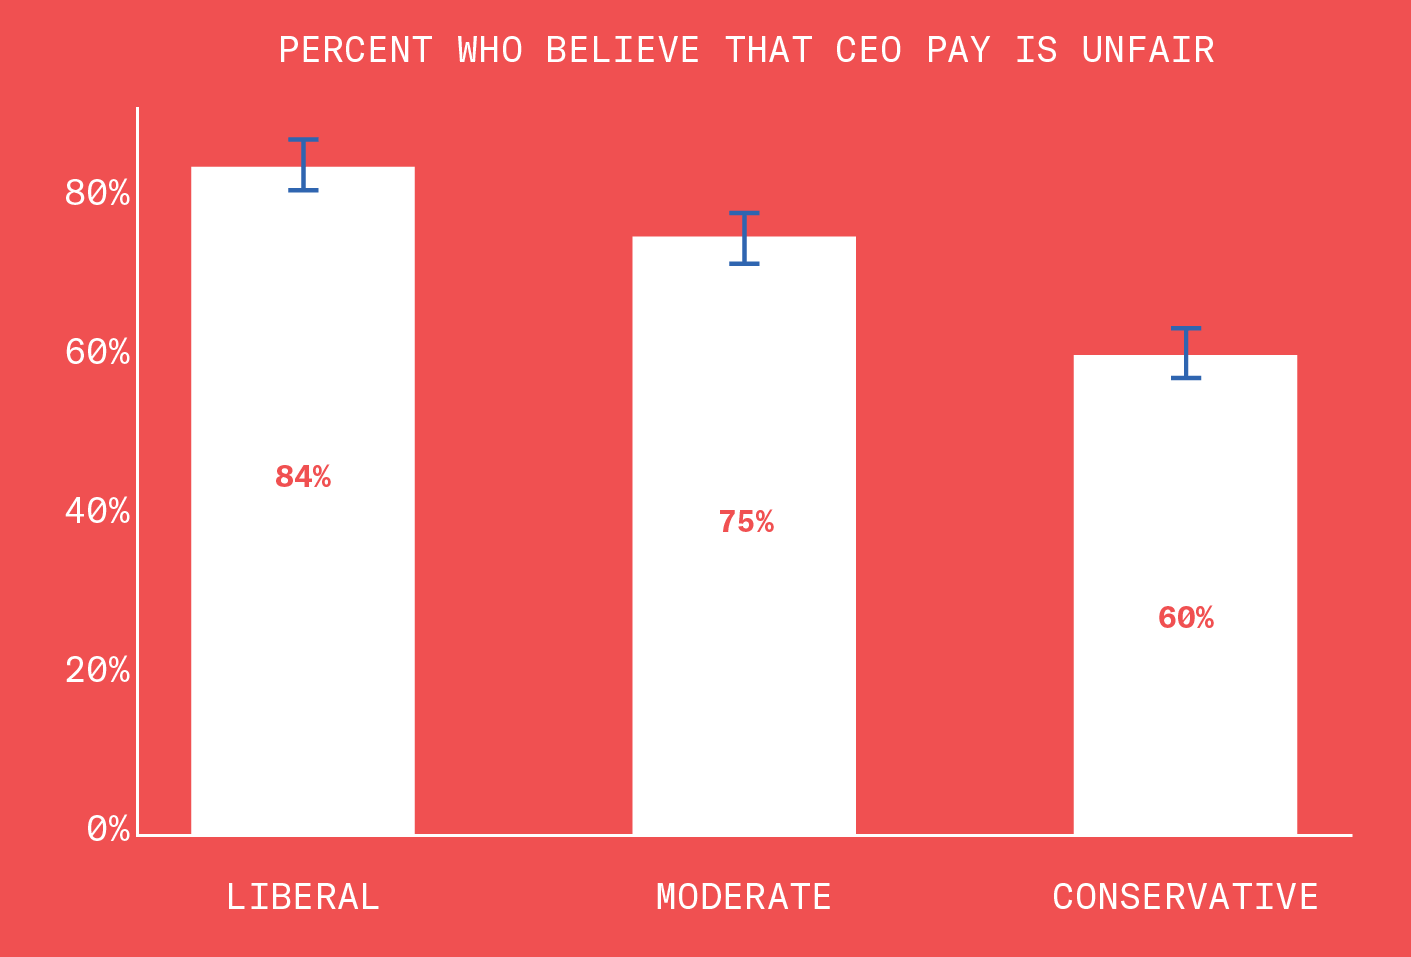
Fairness – 3 of 5
But when it comes to Hollywood movie stars making the same amount of money, closer to half of respondents say this is unfair.
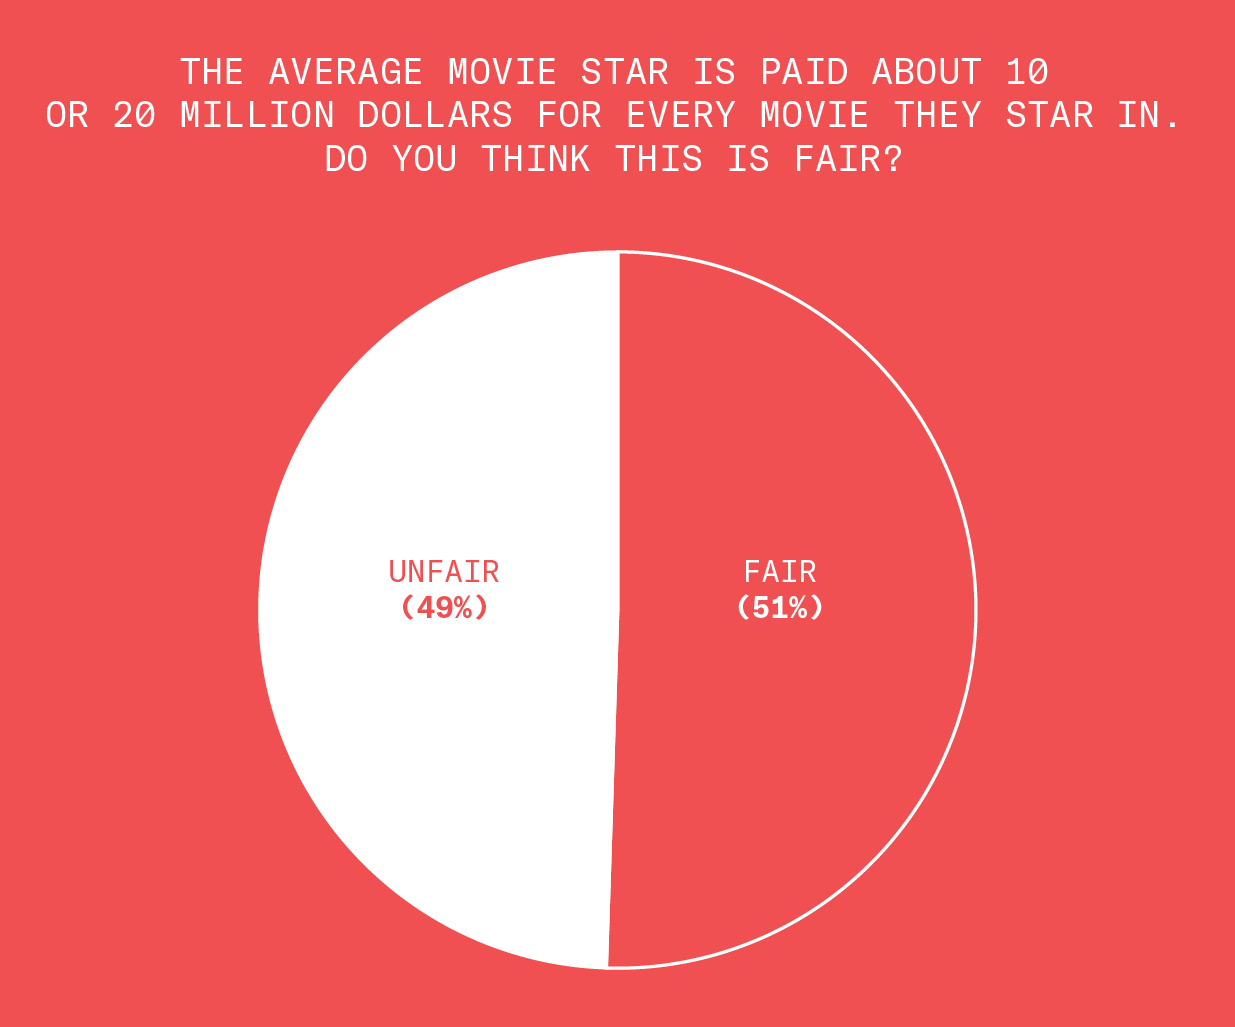
Fairness – 4 of 5
Conservatives are more likely to say this is unfair than liberals.

Fairness – 5 of 5
Nearly half of the liberals who think it is fair for movie stars to make millions think it is unfair for CEOS to make millions.
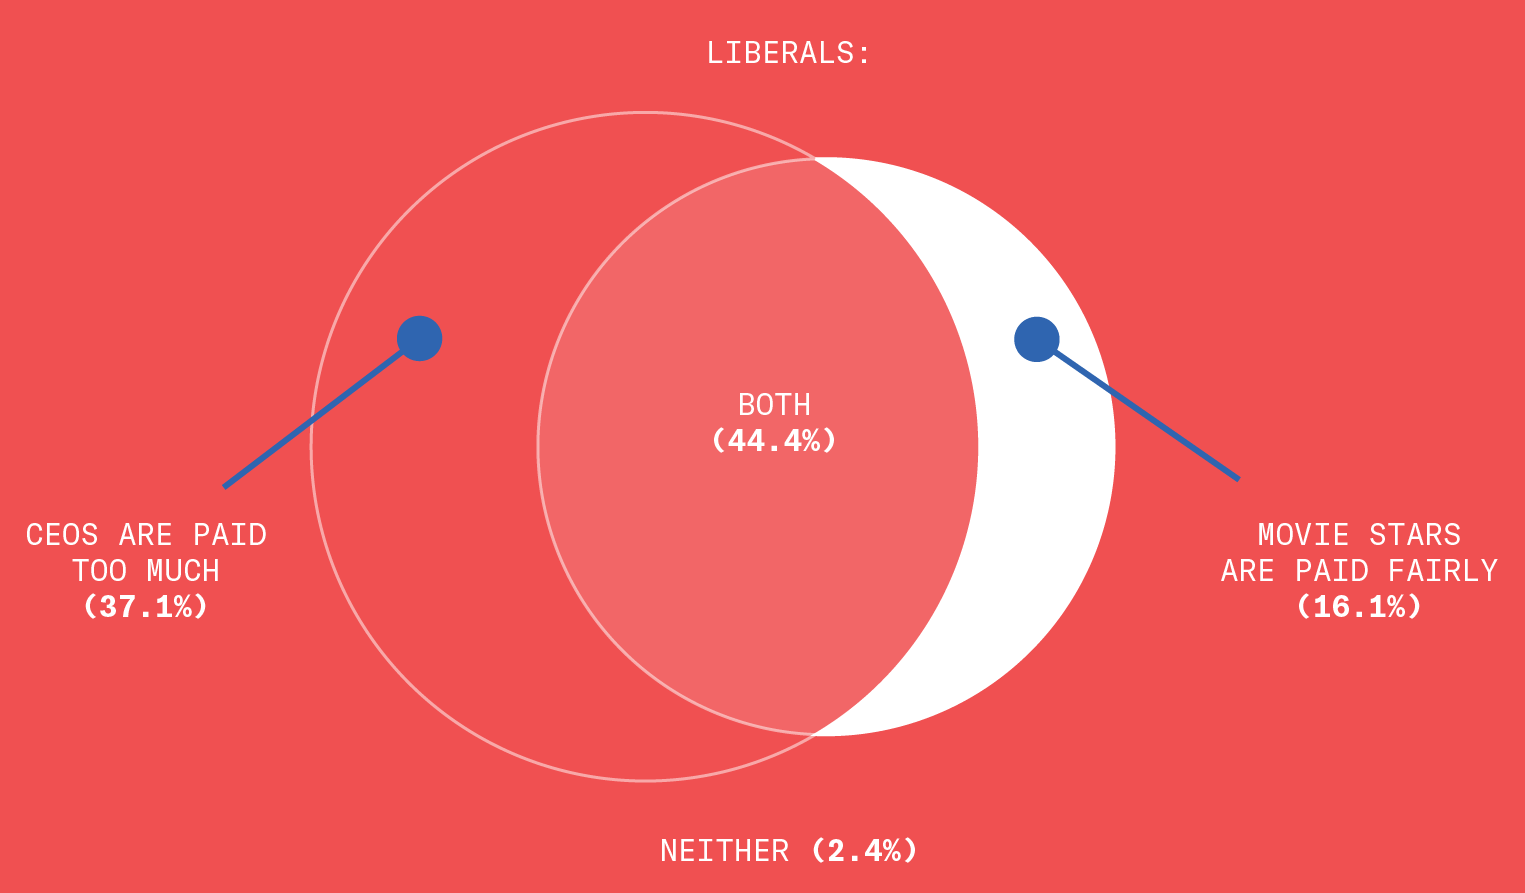
In sum, CEOs = faceless, evil conservatives. Movie stars = cool liberals I want to be friends with.
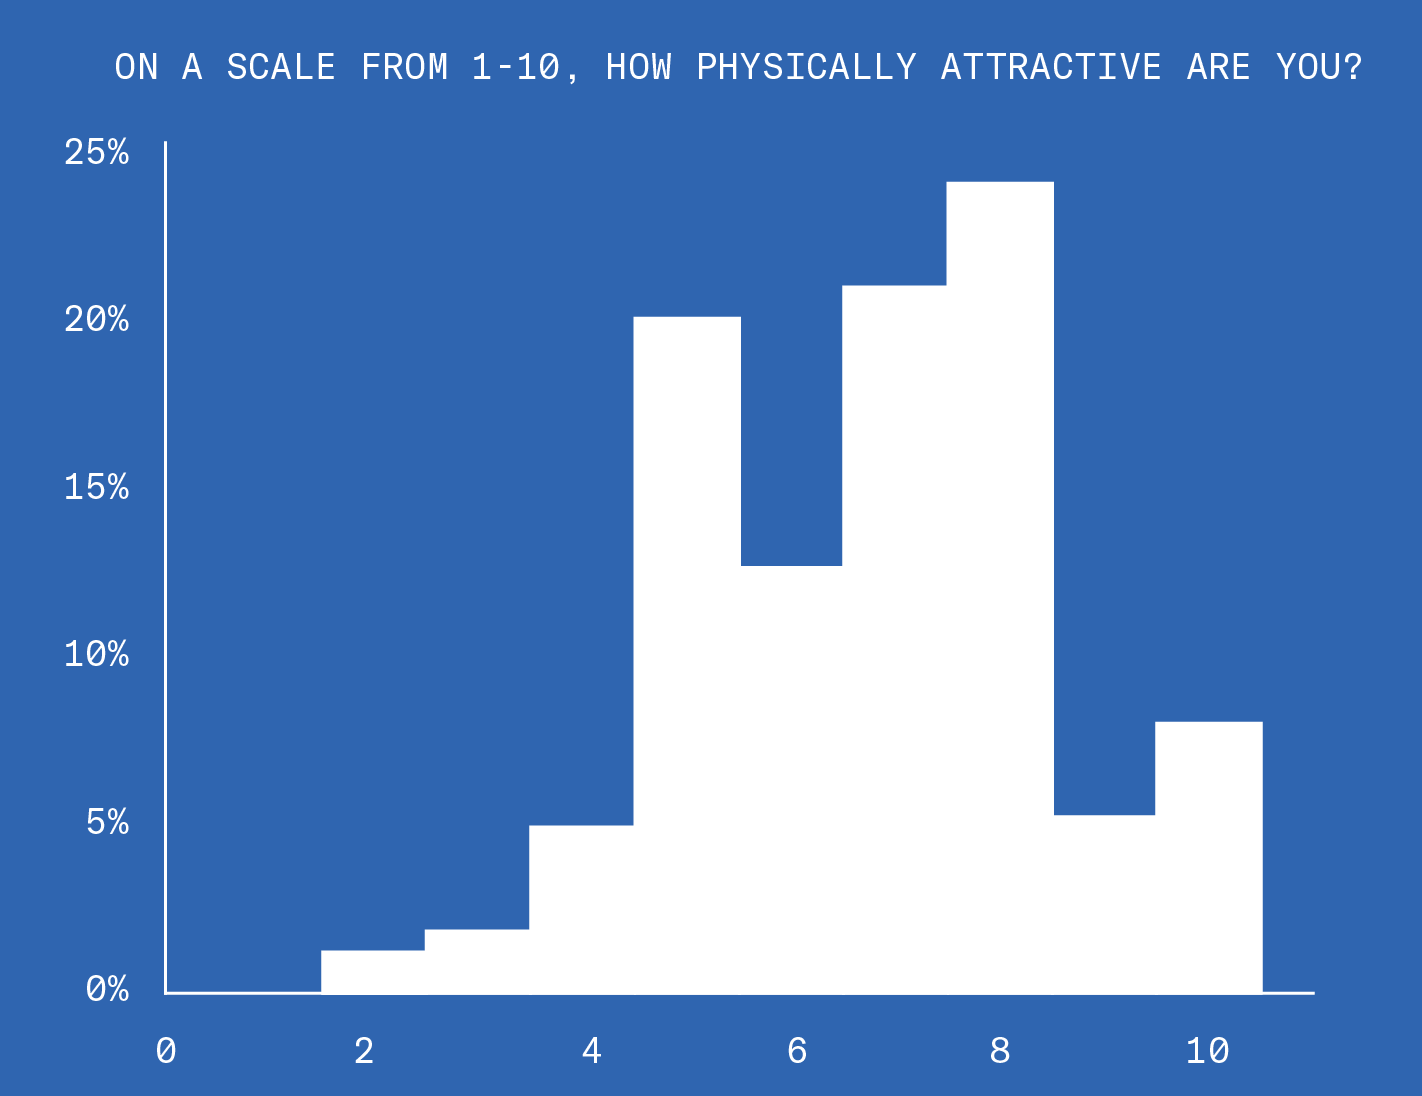
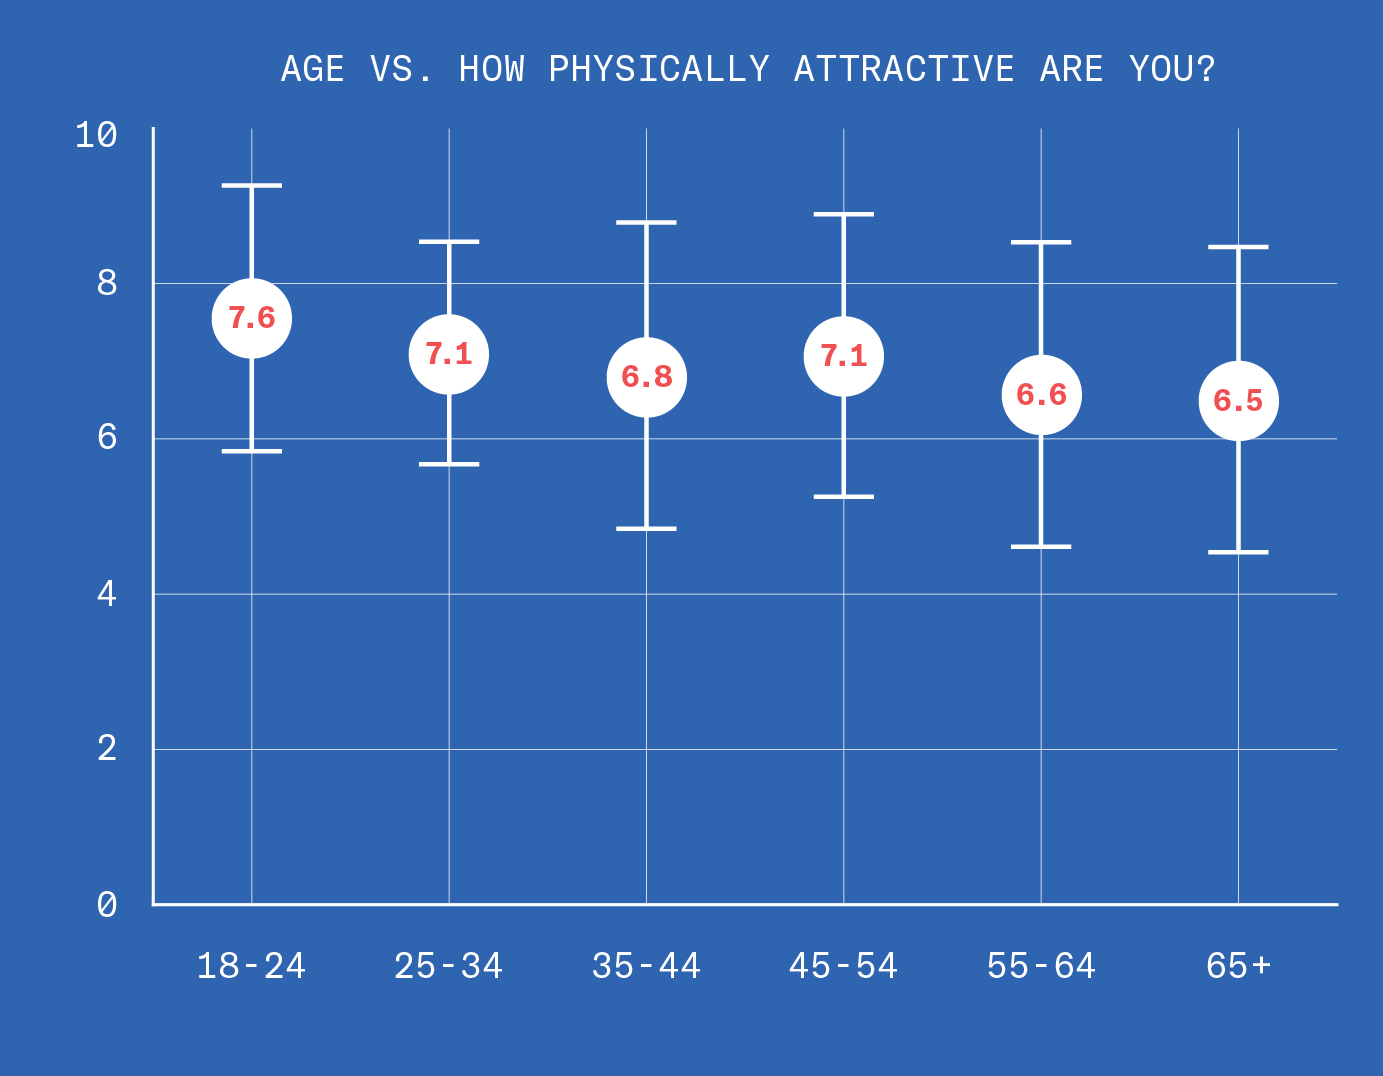
Hot or Not
Now for the important stuff: on a scale of 1 to 10, how physically attractive are you? Of the people who didn’t hang up, most thought they were pretty attractive.
Hot or Not – 2 of 3
Young people tend to think of themselves as hotter than old people.
Hot or Not – 3 of 3
People of color tend to think of themselves as hotter than white people.
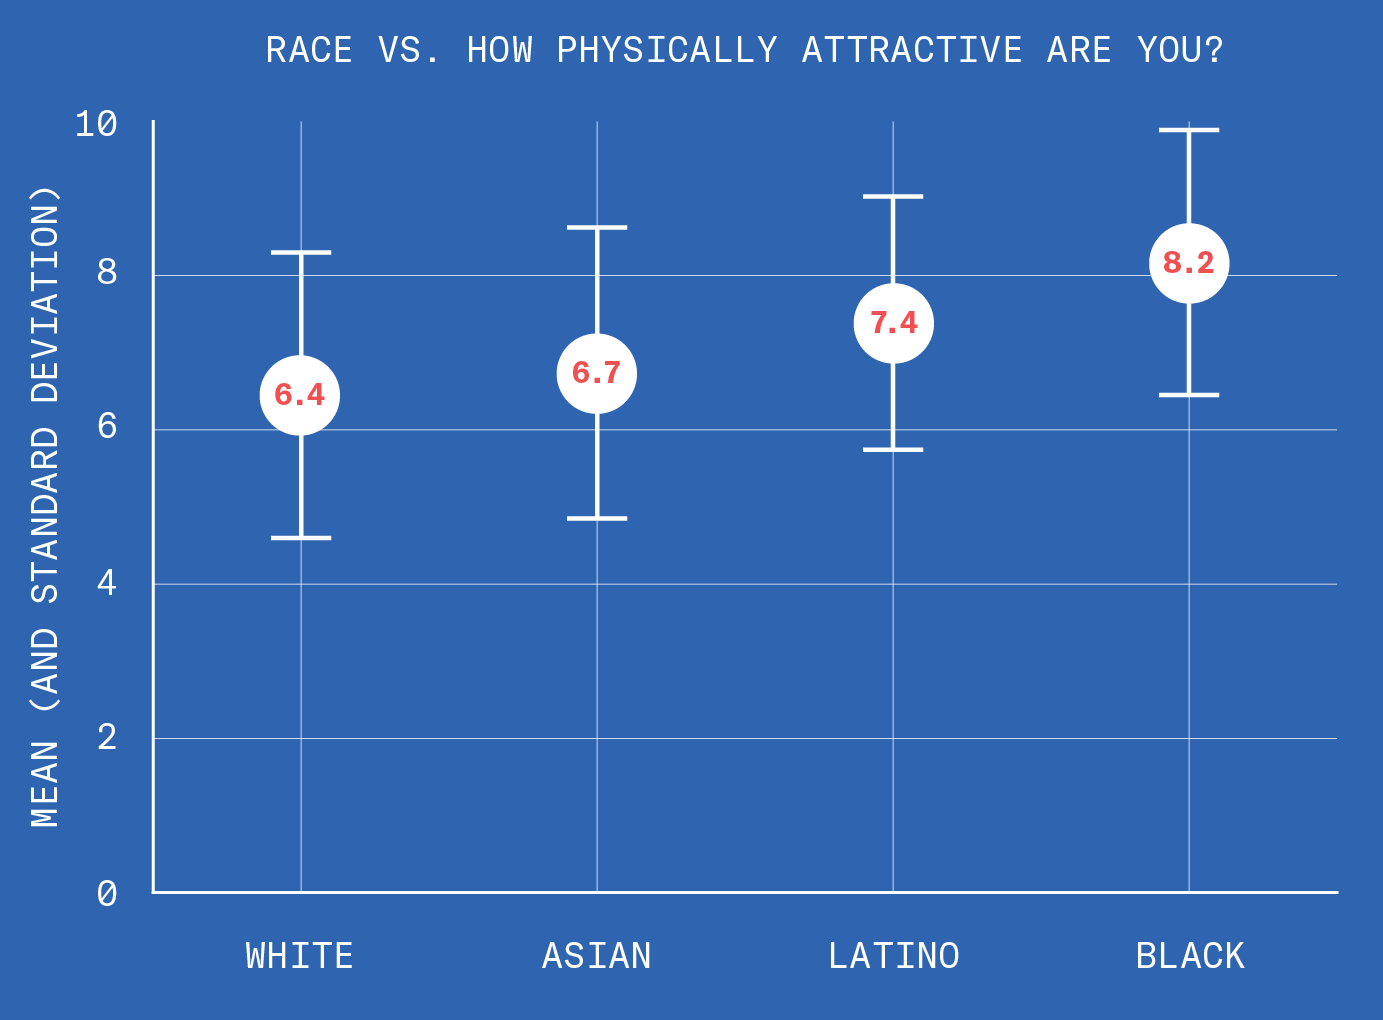
They’re probably right.
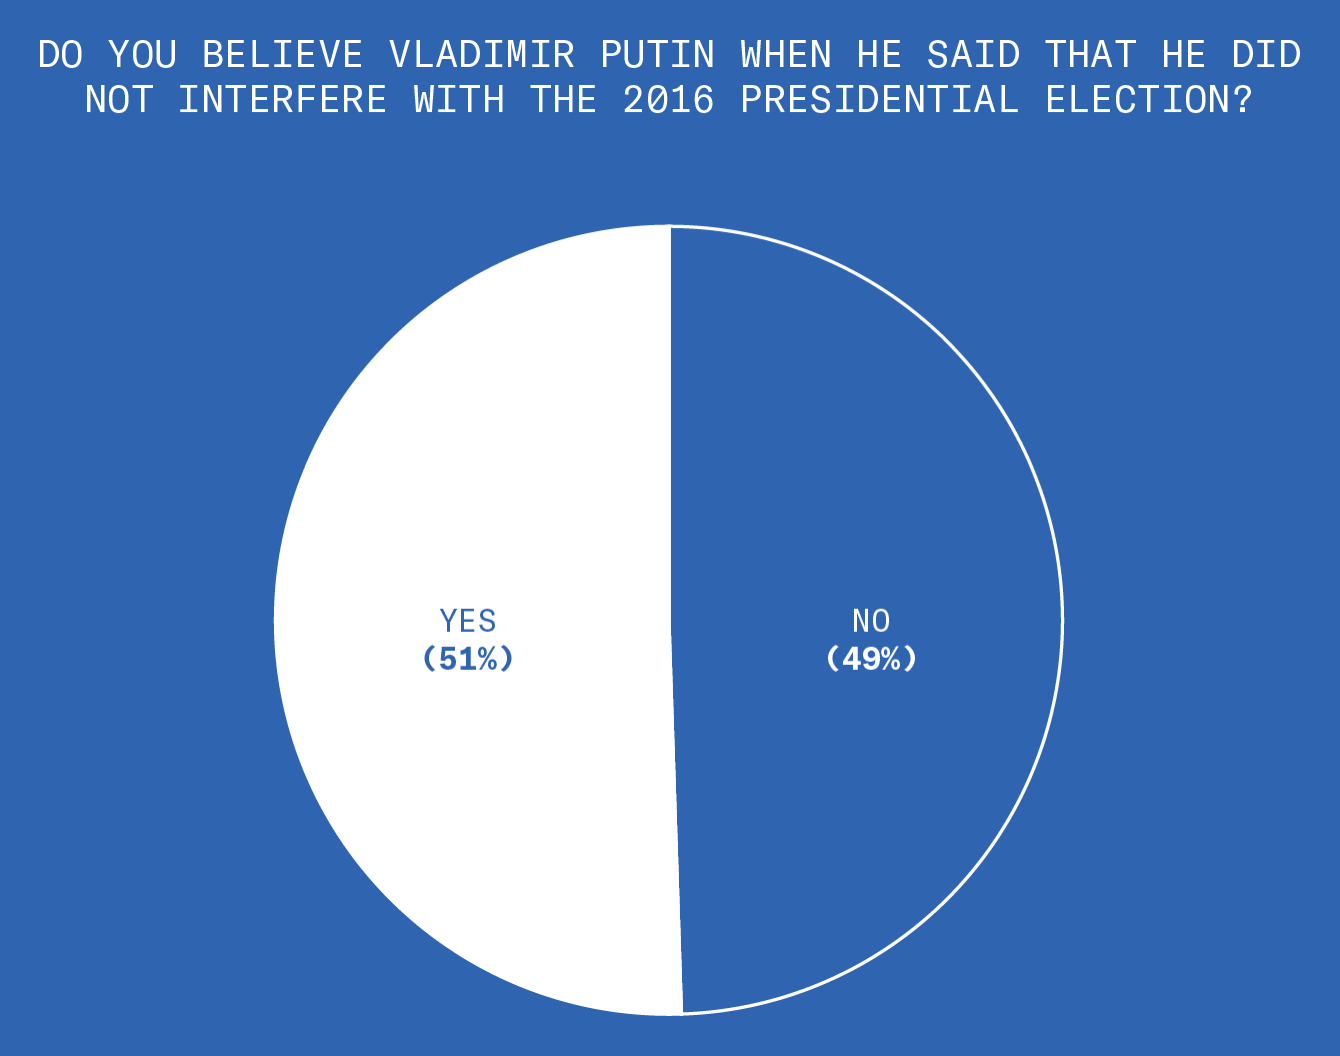
Russia
Do you believe that Russia interfered with the presidential election? This shouldn’t be a partisan issue—it’s a well-reported fact—and yet… oh no.

Russia – 2 of 2
Of the people who believe Russia interfered with the election, nearly one in five support military action against Russia in retaliation.
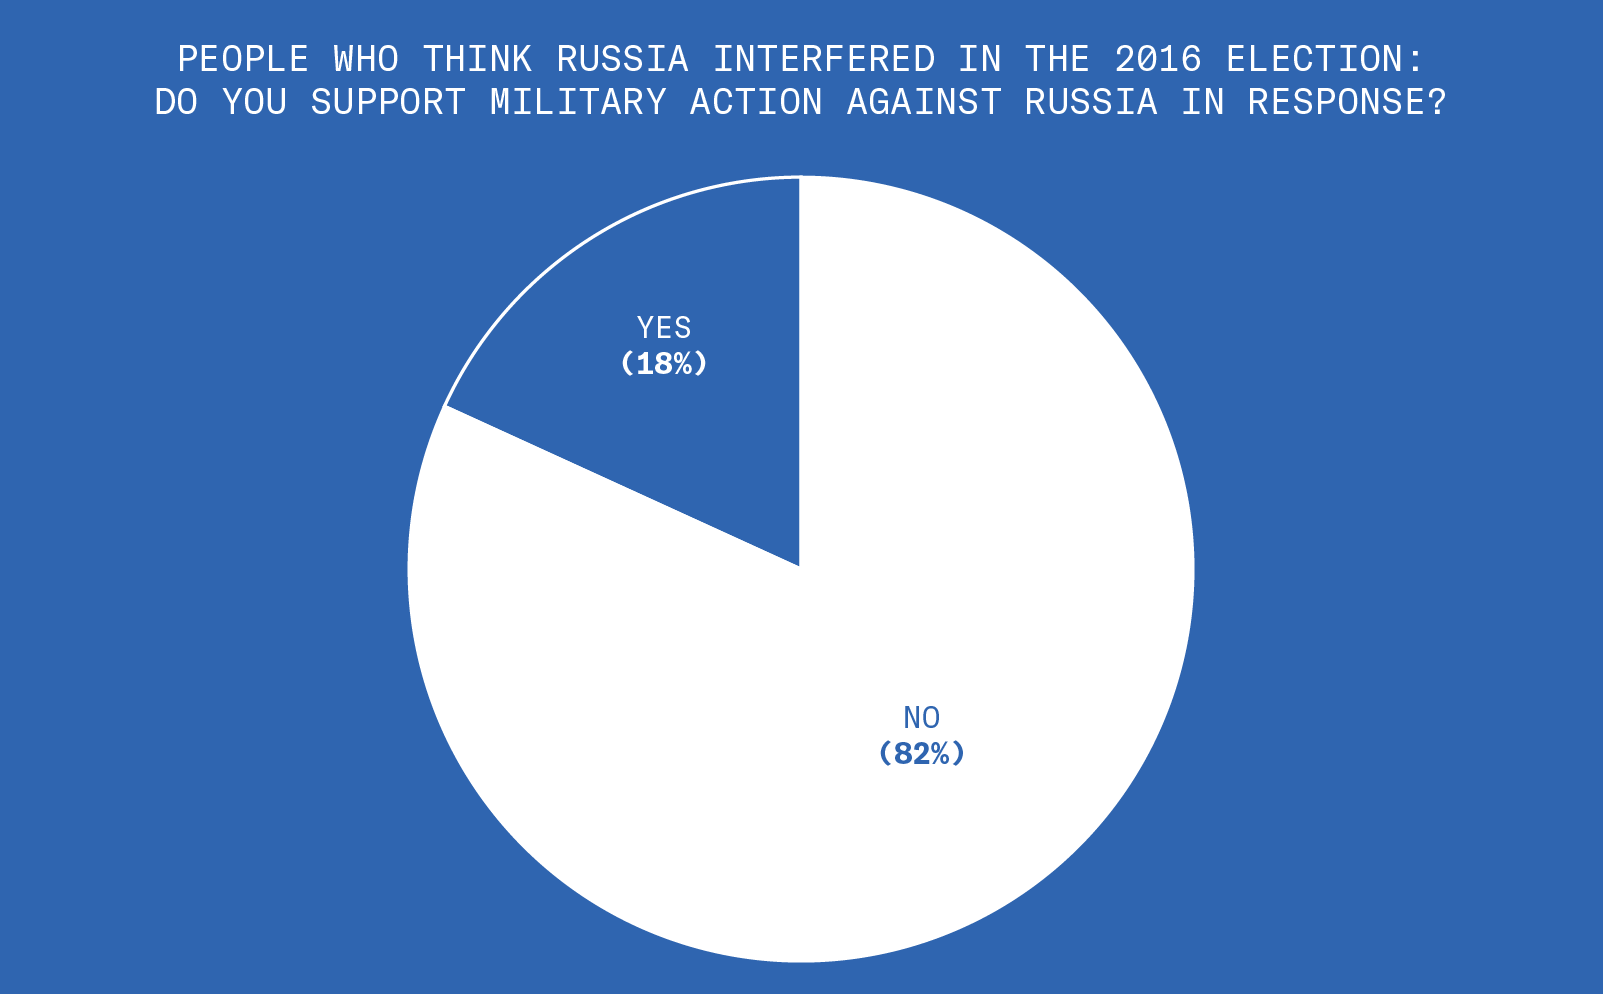
Do you want a nuclear war? This is a great way to get a nuclear war.
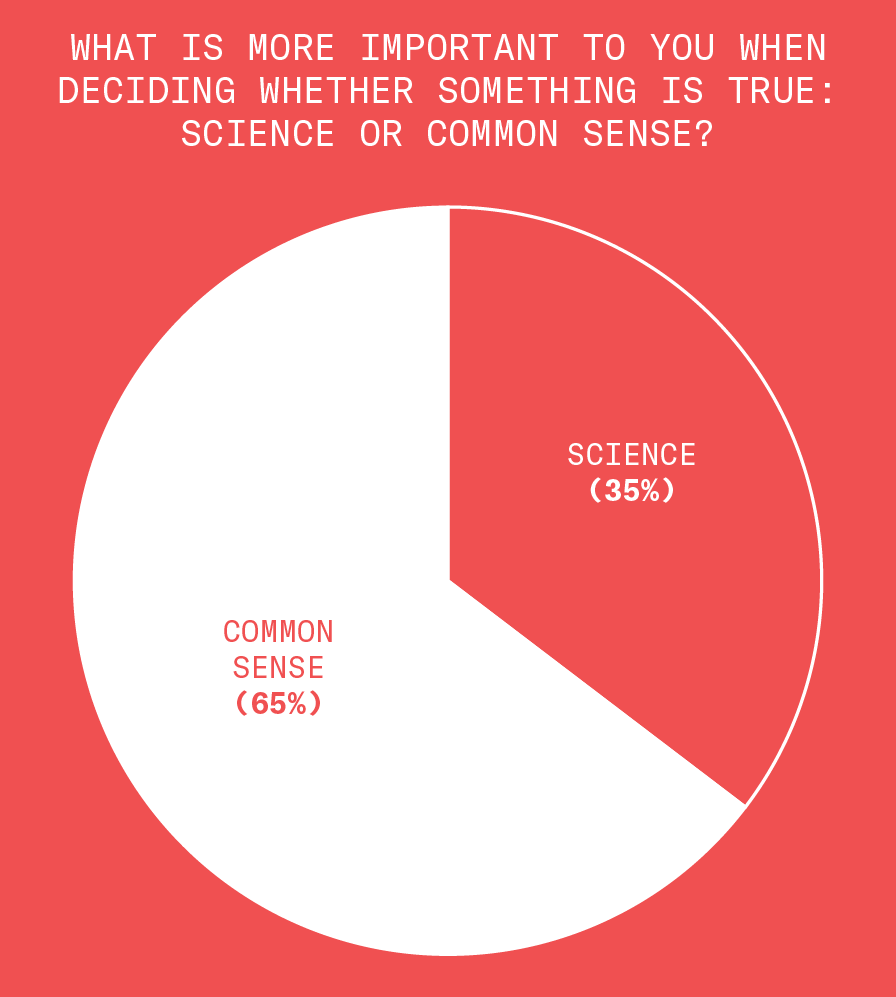
Common Sense
Two-thirds of Americans trust "common sense" more than science.
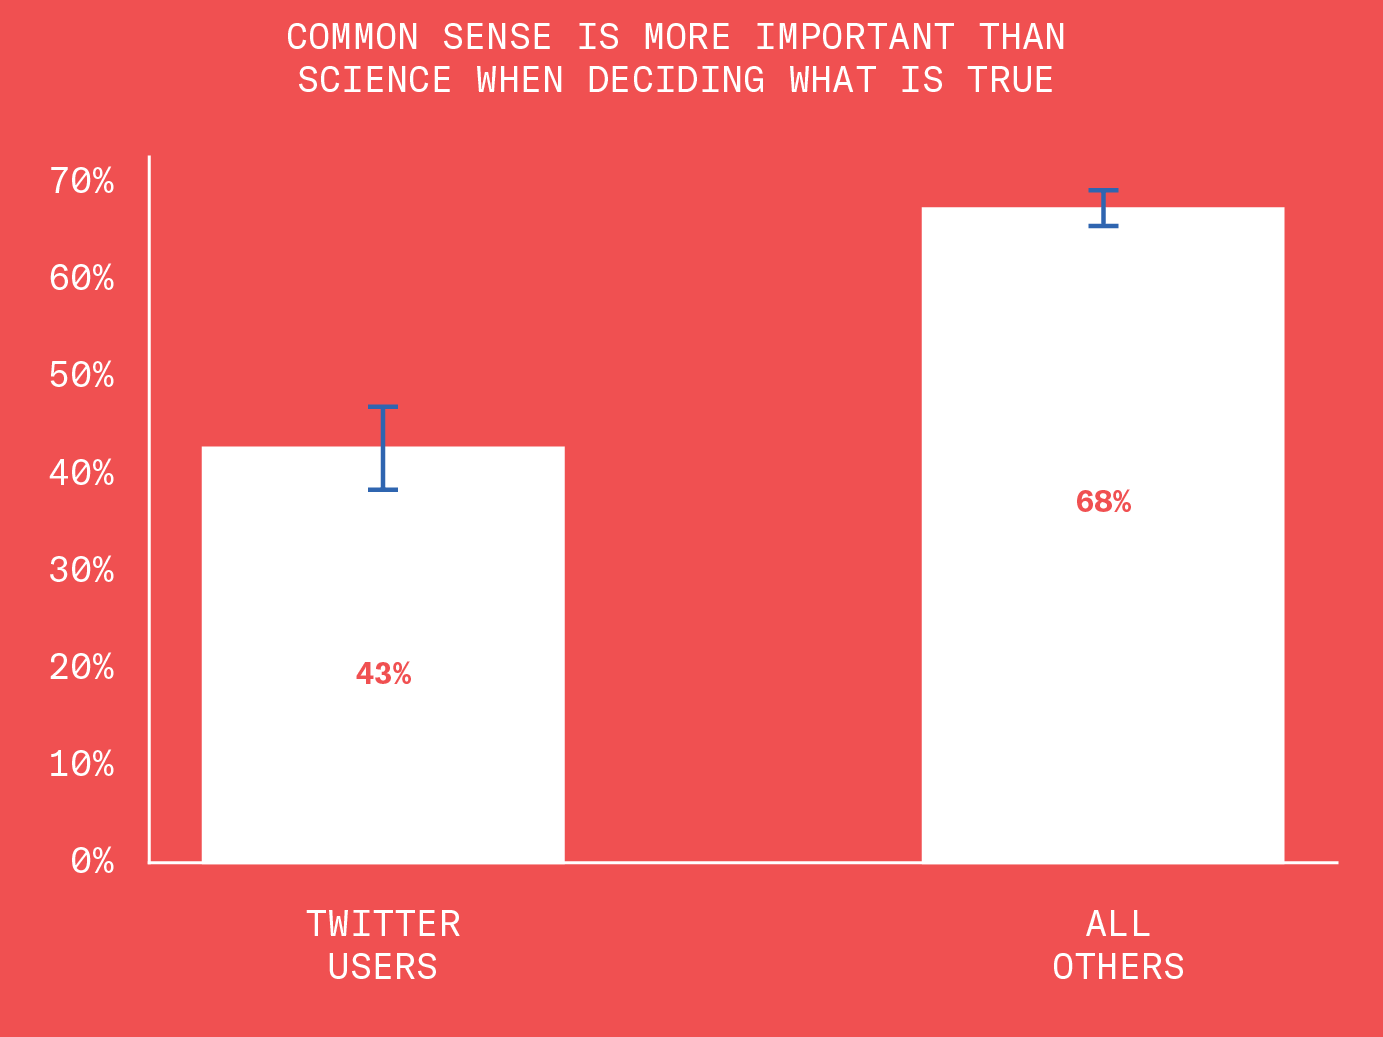
Common Sense – 2 of 5
Whether you trust science or common sense more says a lot about you. People who trust common sense tend to be older, less educated, and less likely to have a Twitter account.

Common Sense – 3 of 5

Common Sense – 4 of 5
Common Sense – 5 of 5
People who trust common sense are also more likely to support military action against Russia in response to their interference with the 2016 election.
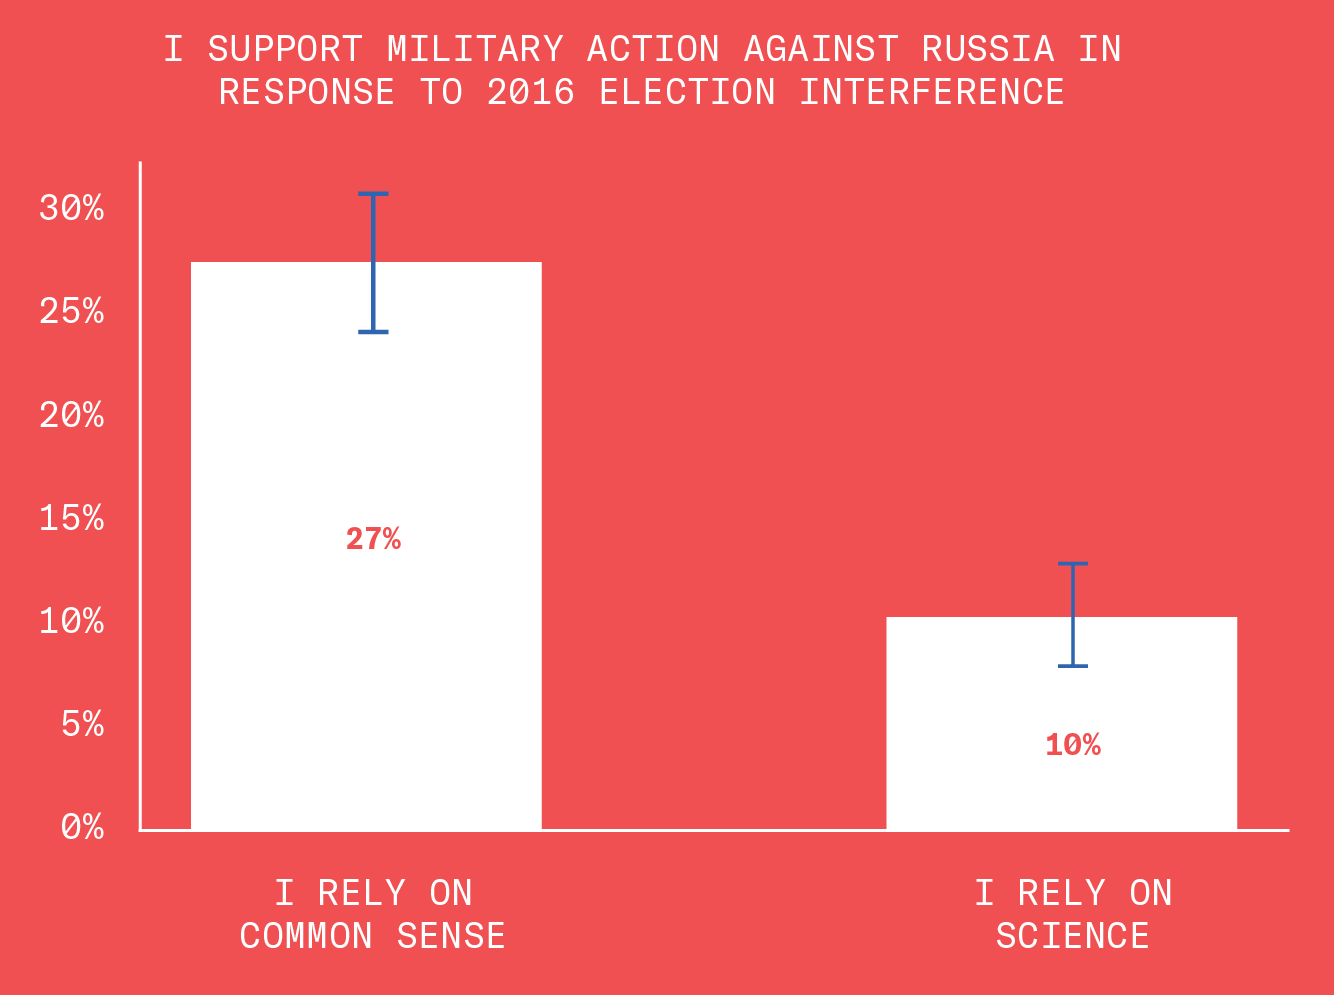
These people should not be trusting their common sense.
Conspiracy Theories
Is there a "deep state" conspiring to undermine the Trump presidency?

It turns out this question is the same as, “Do you support Donald Trump?”
Conspiracy Theories – 2 of 6
How common is the conspiracy theory that the Parkland school shooting was a left-wing, anti-gun hoax? On the one hand, it’s not very common. On the other hand, it’s probably millions of people.

Conspiracy Theories – 3 of 6
People who think there’s a “deep state” are seven times more likely to believe this insanity than the people who don’t.

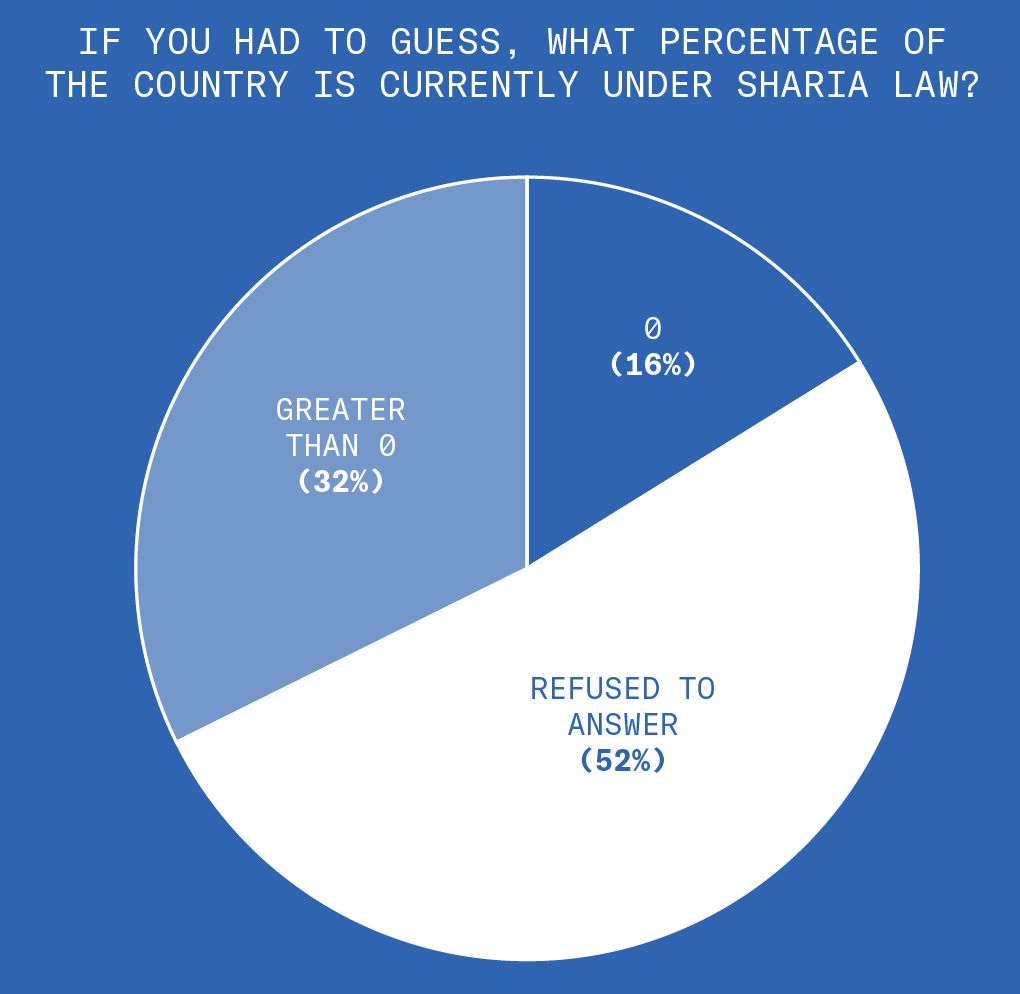
Conspiracy Theories – 4 of 6
If you had to guess, what percentage of Americans are currently under Sharia Law? Half of our respondents didn’t know or refused to answer. But of the ones who did answer, a good chunk of them gave a number higher than zero.
Conspiracy Theories – 5 of 6
Good news! Most Americans understand that wrestling is fake and the Earth is round.
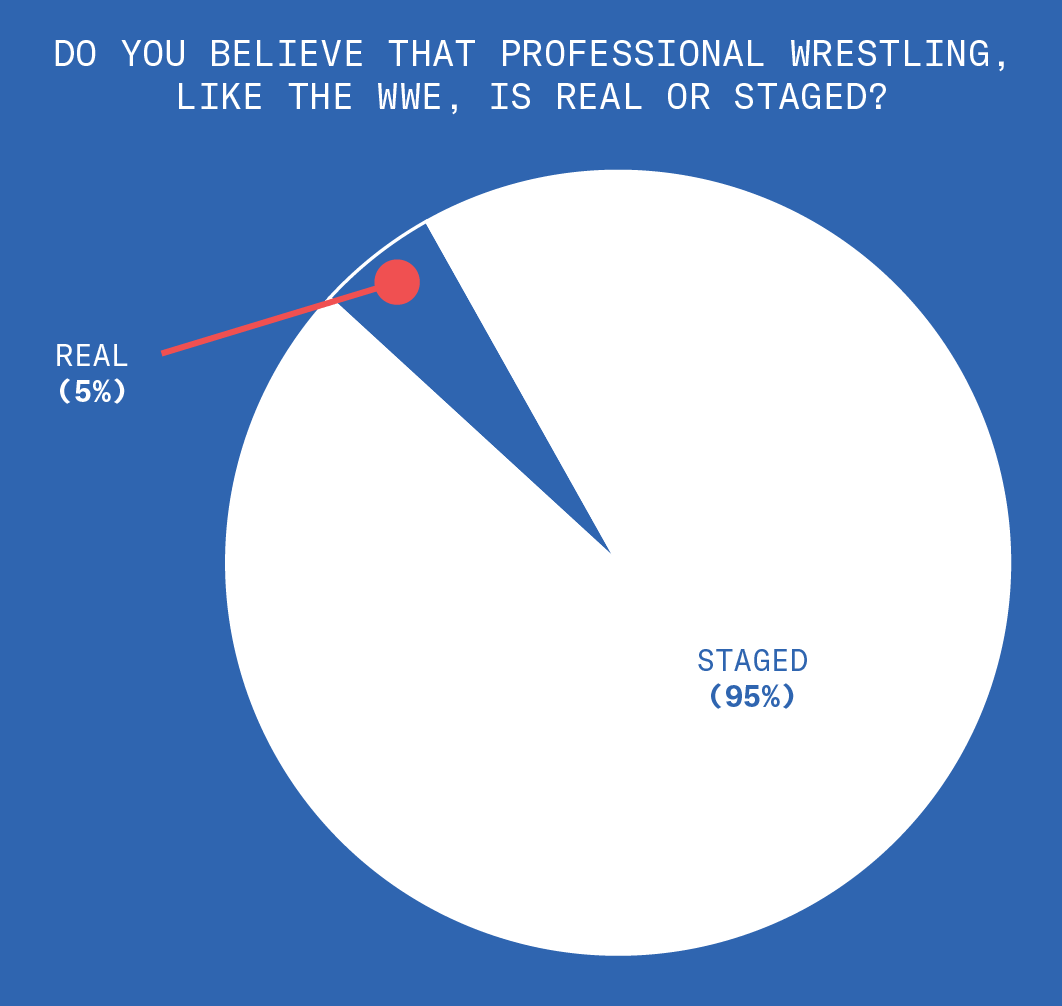
Conspiracy Theories – 6 of 6
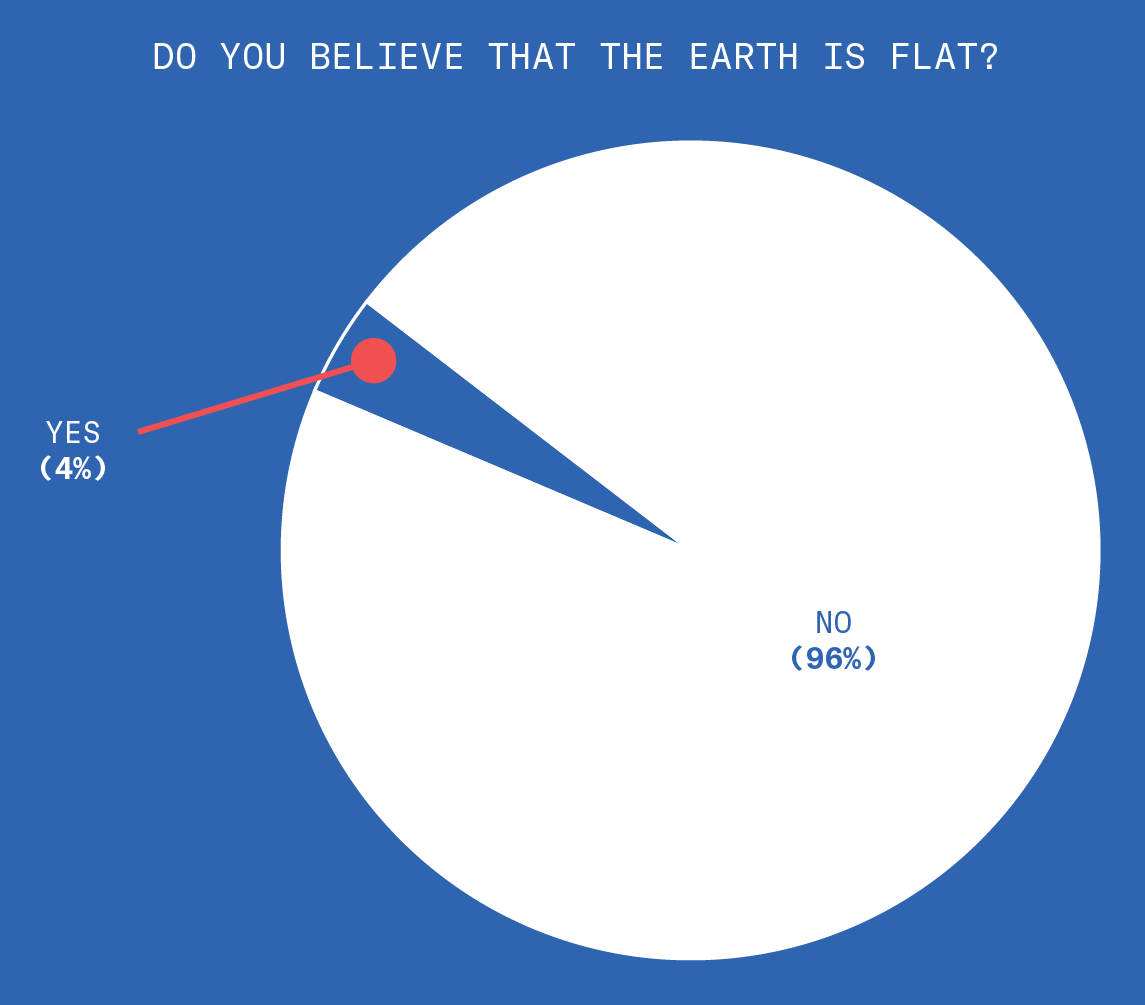
We were worried about these questions, and we’re glad we can relax.
Extra Tidbits
People talk about how social media is destroying Western civilization, yet our results suggest that barely anyone has a Twitter account.
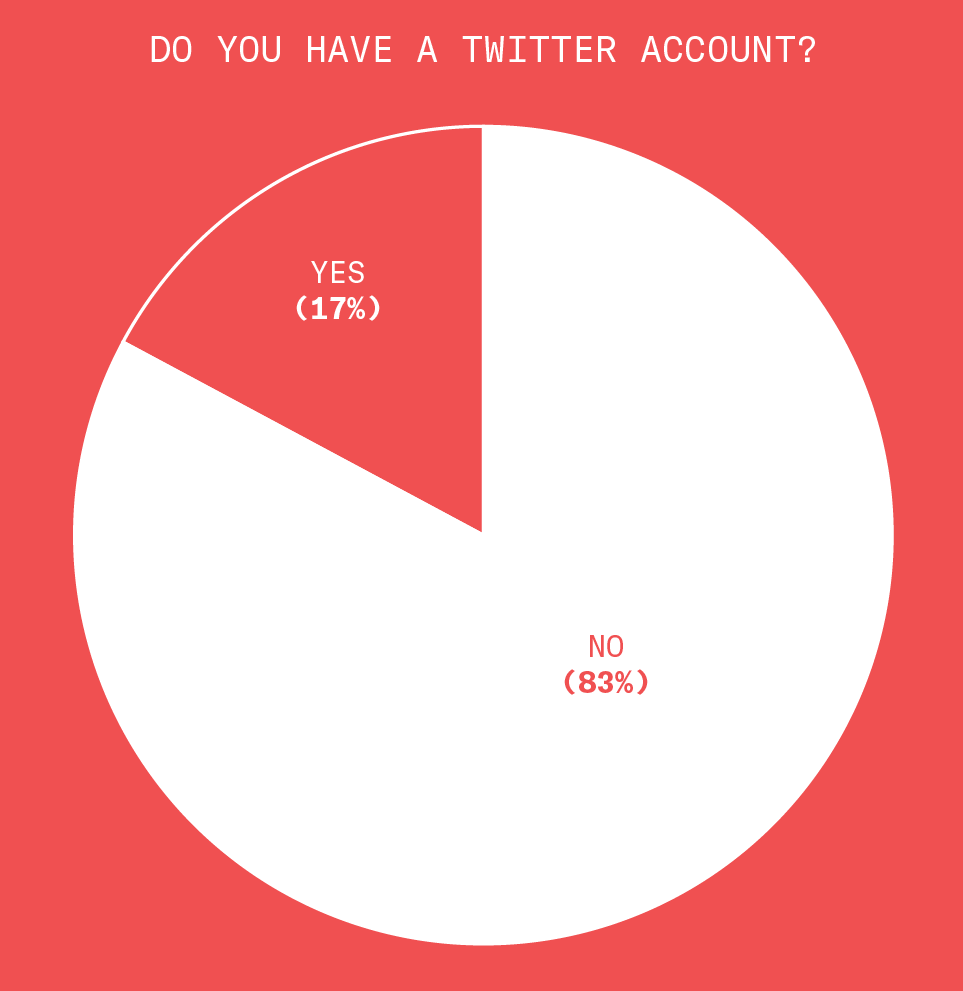
Calm down, guys.
Extra Tidbits – 2 of 4
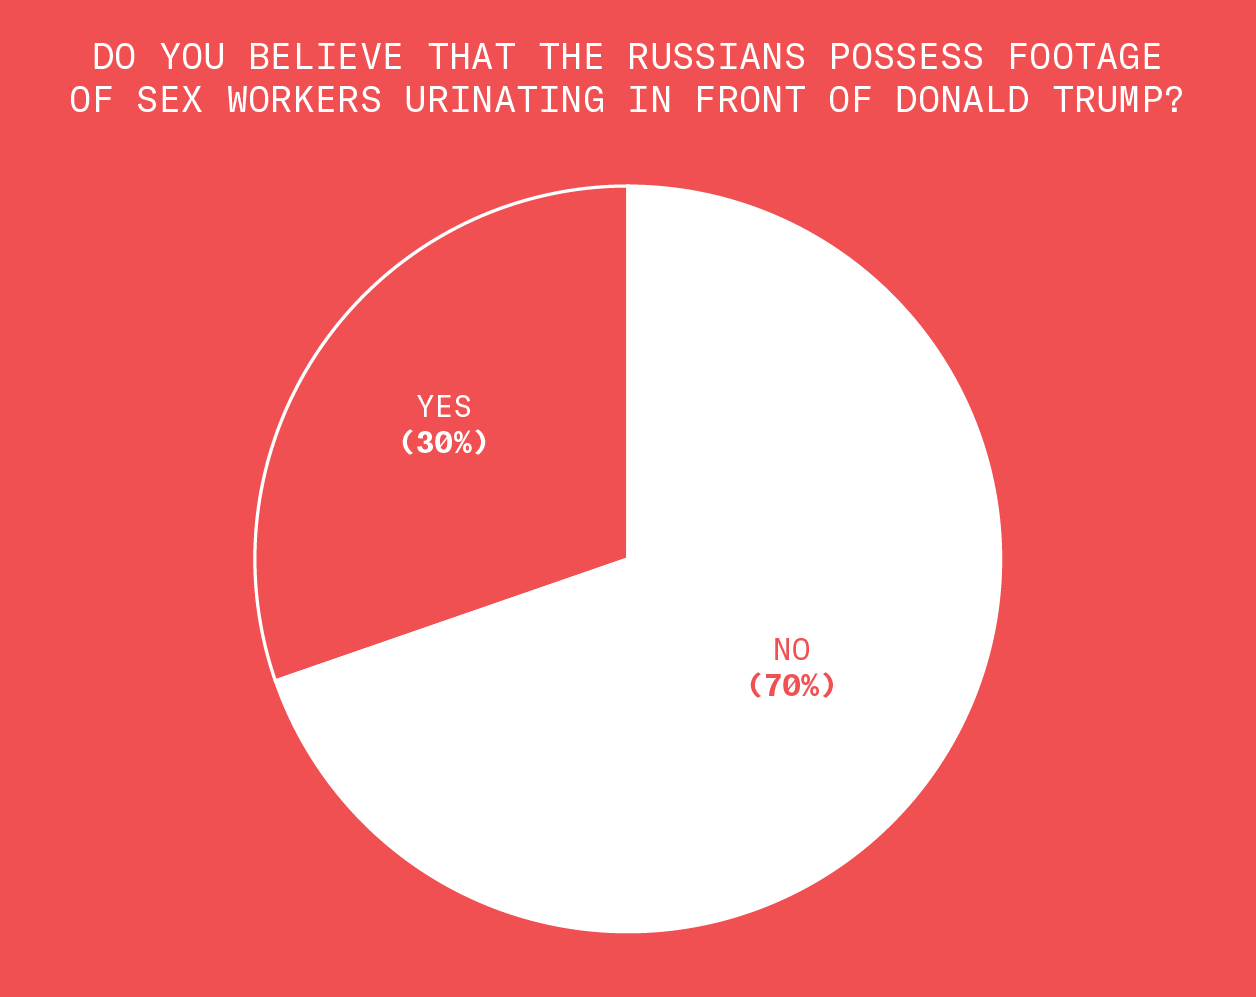
Most people don't believe the pee tape is real.
Extra Tidbits – 3 of 4
Nearly half of Americans are not aware that the U.S. has interfered with the democratic elections of other nations in the past (or they are in denial).
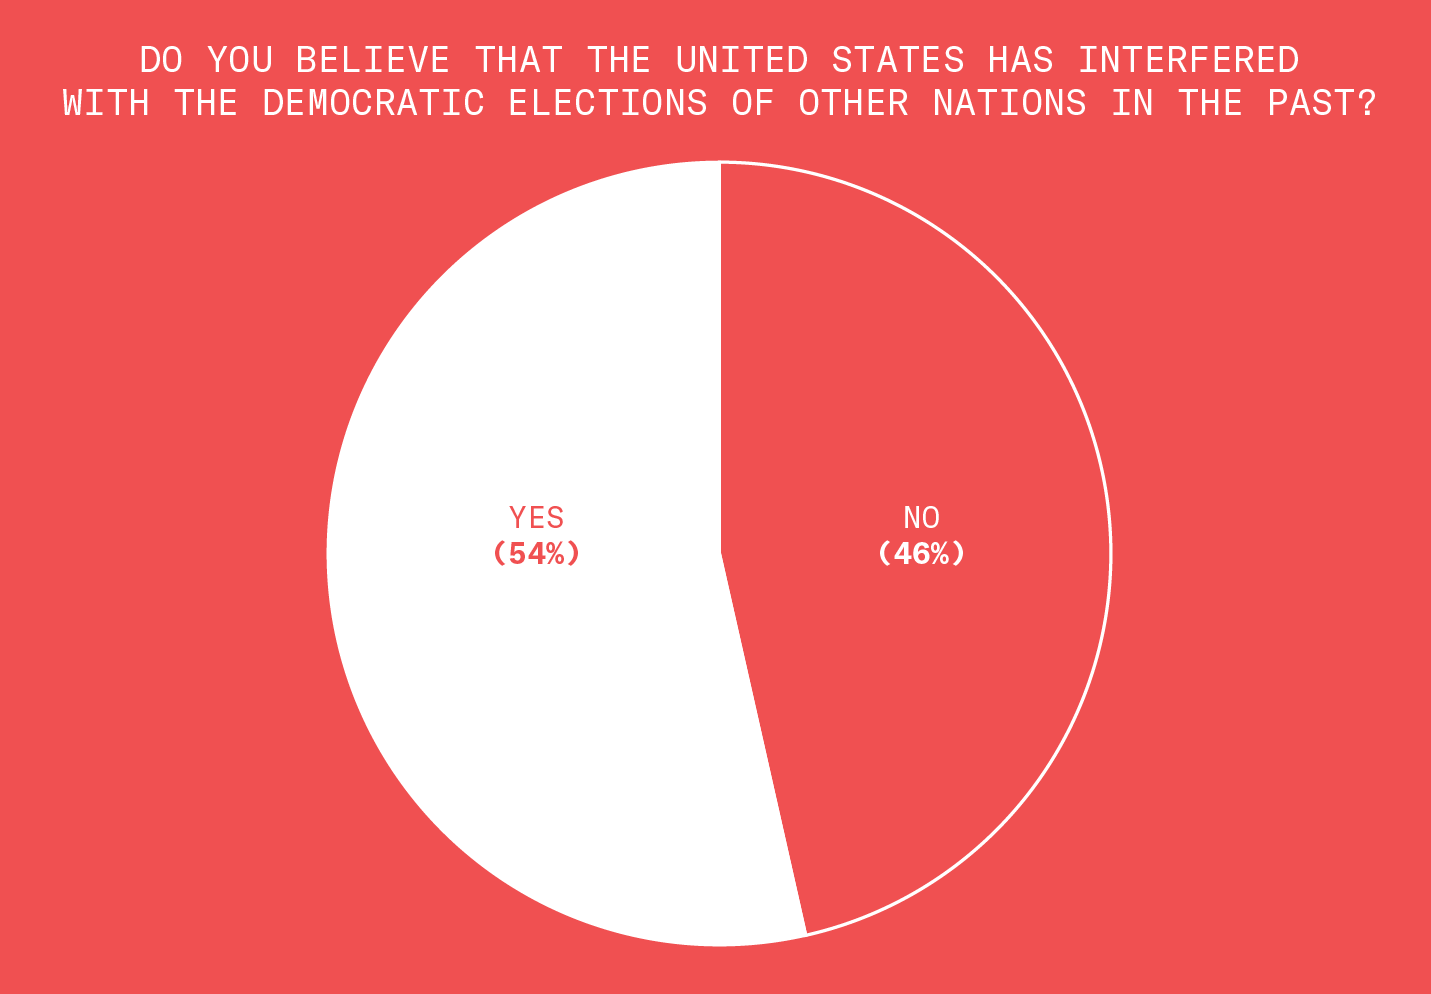
Extra Tidbits – 4 of 4
Republicans are more likely to believe in a fake history than Democrats.

FYI, here’s the Wikipedia page showing how many times we’ve done this.
Knowledge is Power
For this month's Pulse of the Nation, we sought to test people's political knowledge. So we started with a softball: do you think it’s good for a country to have a high GDP or a low GDP?
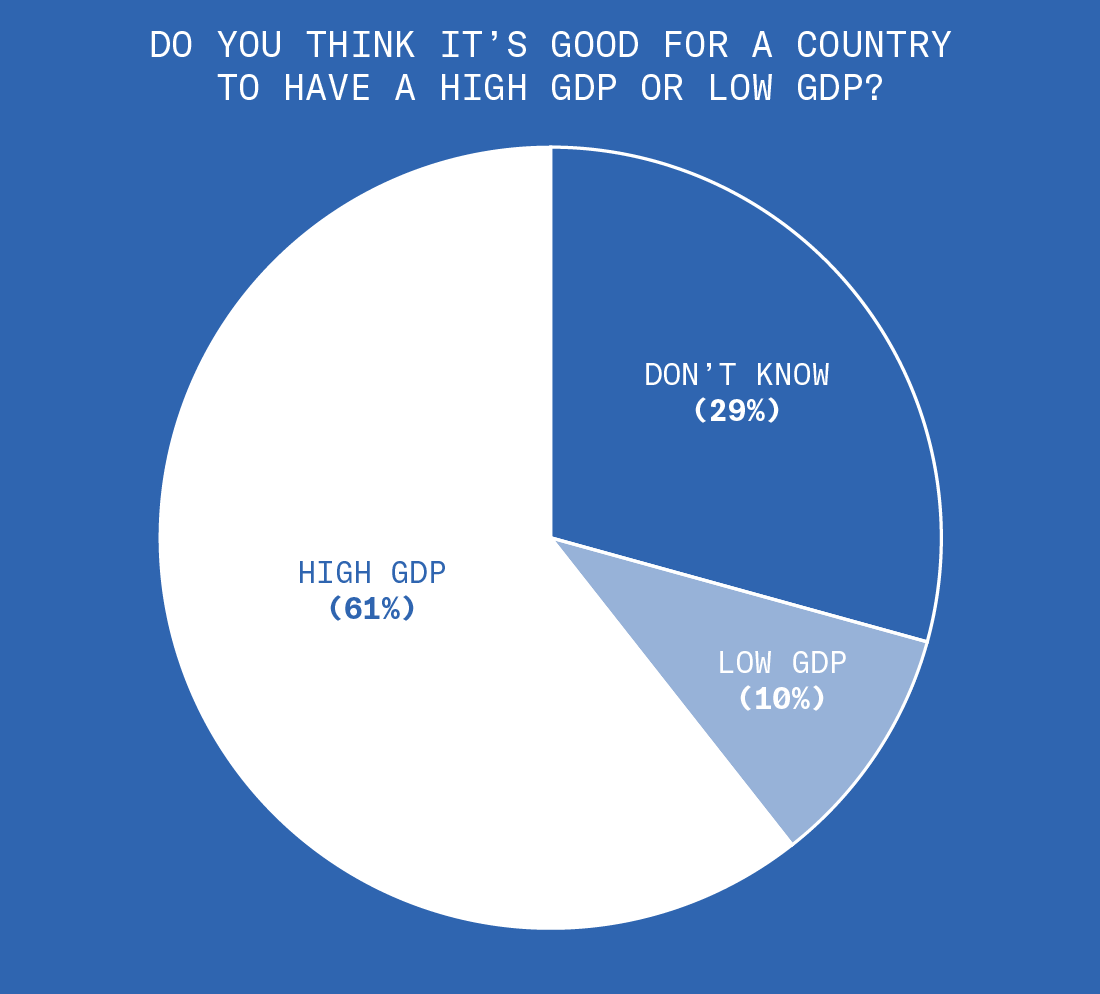
We might be in for a bumpy ride.
Knowledge is Power – 2 of 4
The majority of our respondents could not name the three branches of government.

Oh my god.
Knowledge is Power – 3 of 4
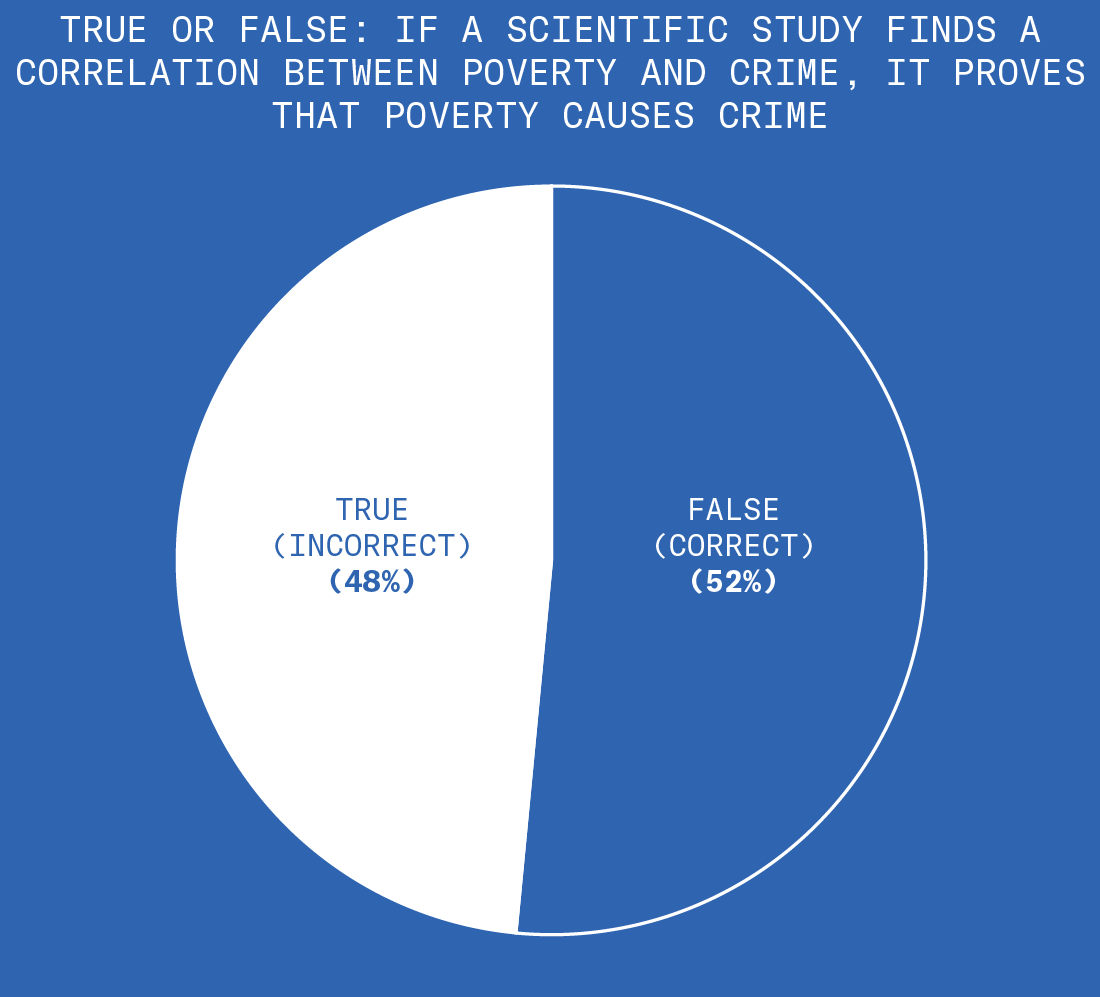
True or false: If a scientific study finds a correlation between poverty and crime, it proves that poverty causes crime.
The correct answer is false (correlation is not causation), but our respondents were about as knowledgeable as a coin flip.
Knowledge is Power – 4 of 4
Most of our respondents are aware that the Statue of Liberty is not located in Washington, D.C.
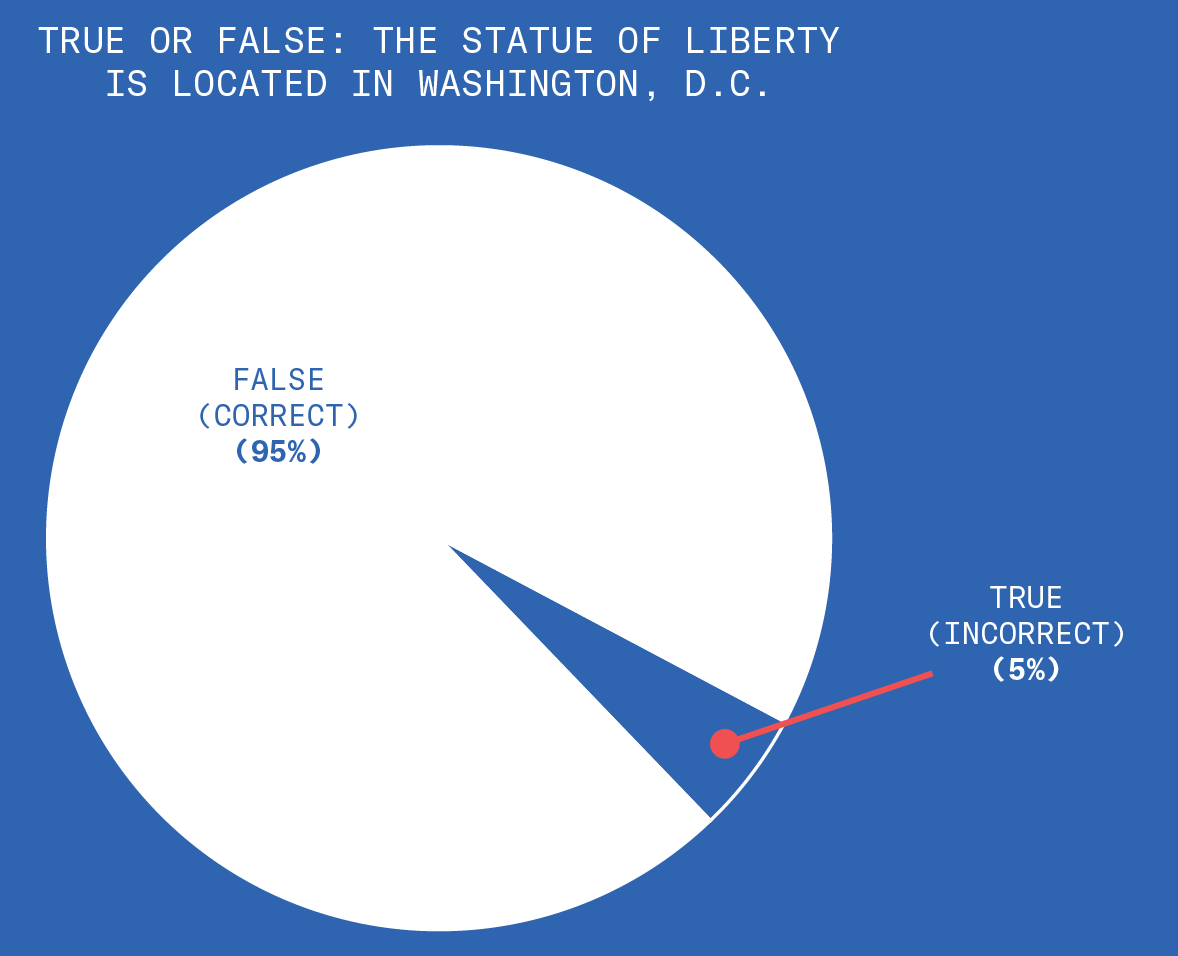
Good news! Great job! You get a gold star!
The Dismal Science
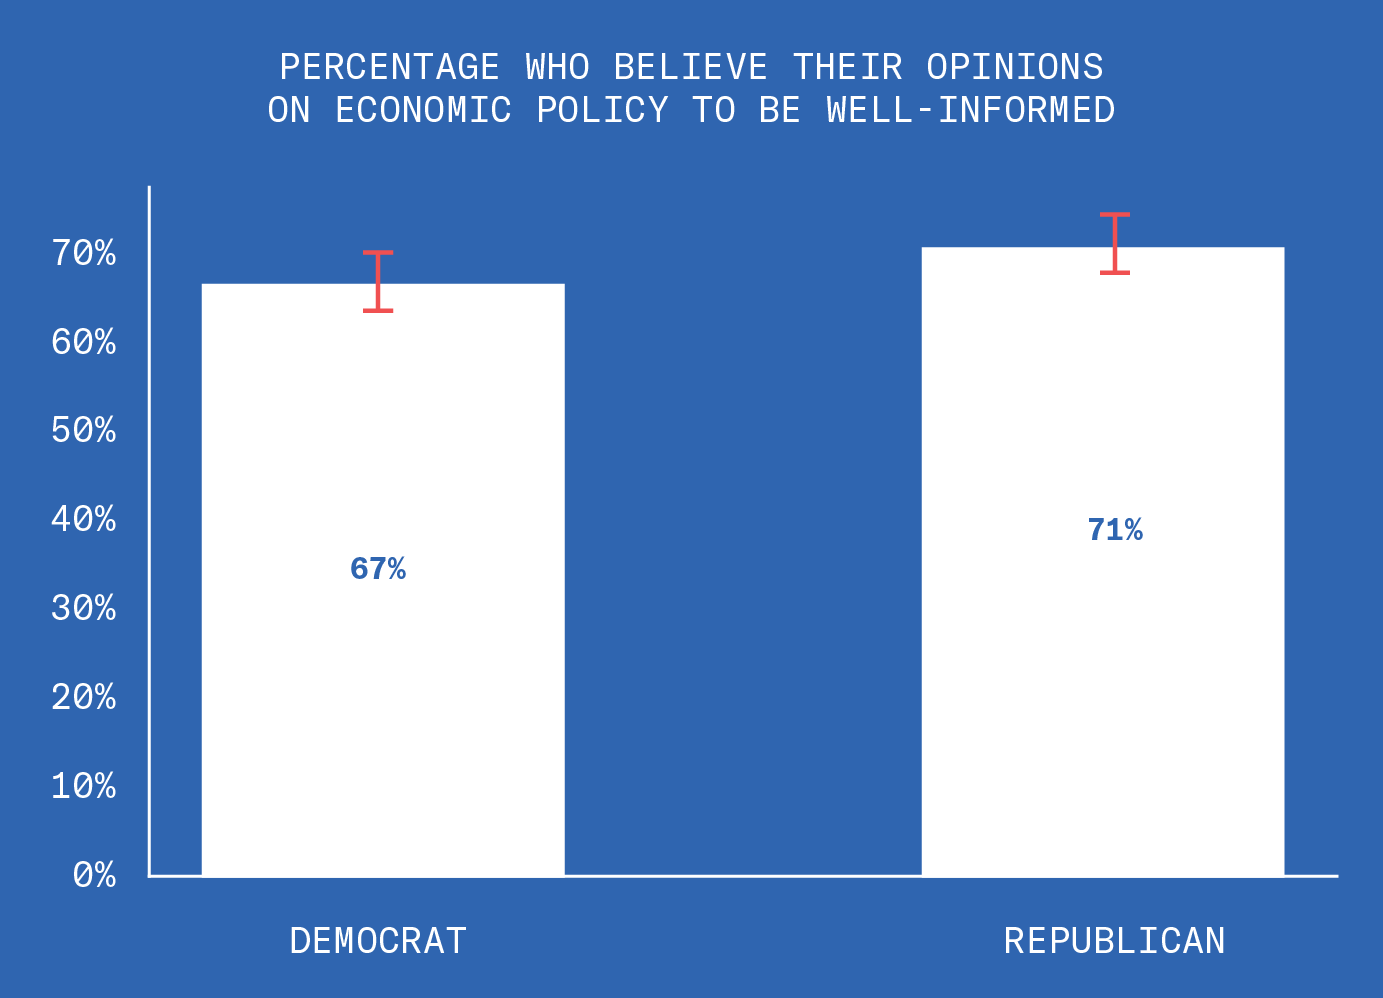
Most of our respondents considered their opinions on economic policy to be "well-informed.”
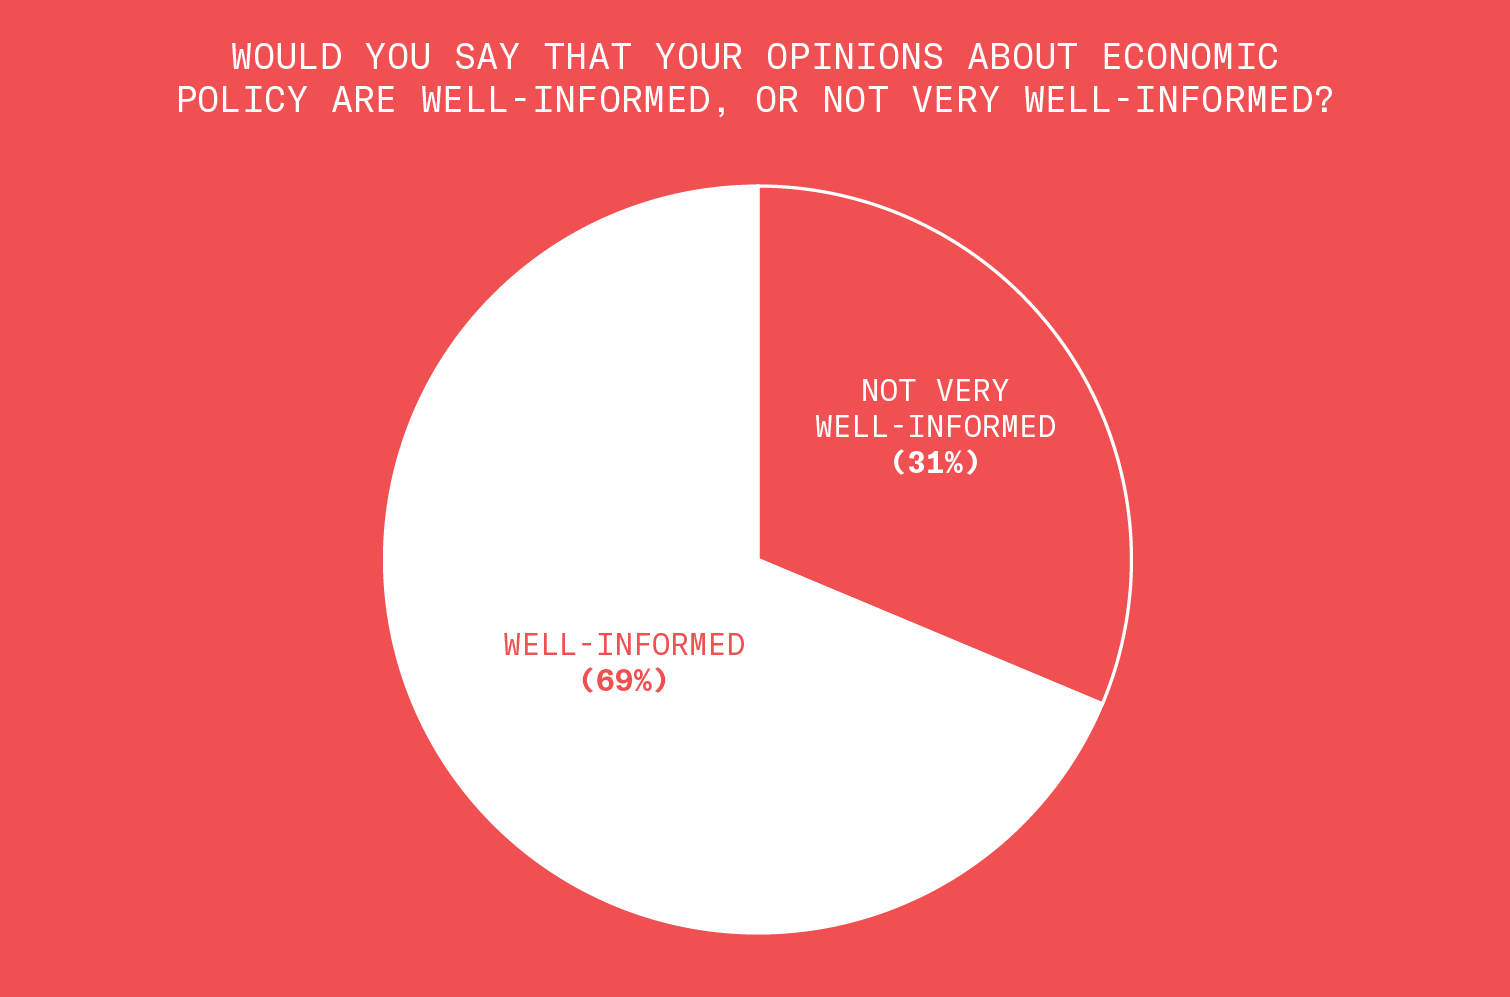
The Dismal Science – 2 of 3
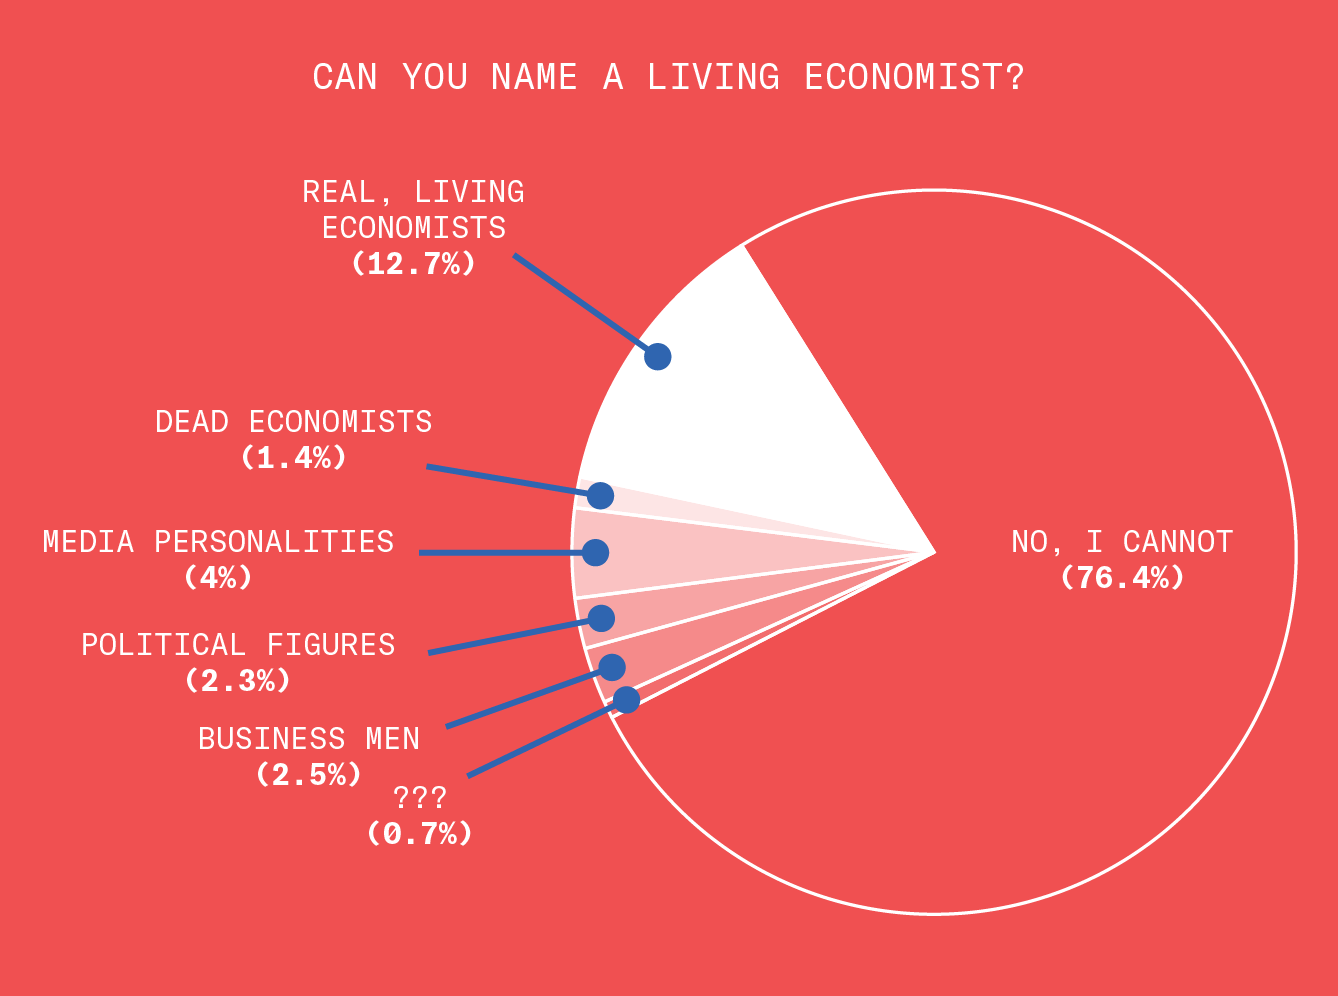
We were curious where their well-informed opinions came from. So we asked them if they could name a single economist who is alive today. Most could not.
Of the people who named anyone, half of them named non-economists, including media personalities (Rush Limbaugh, Jim Cramer), political figures (Al Gore, Donald Trump), and businessmen (Warren Buffet, Mark Zuckerberg).
The Dismal Science – 3 of 3
The people who think their economic opinions are well-informed are the same people who cannot name a living economist.

Maybe democracy isn’t such a good idea.
Red Team vs. Blue Team
Now for the question you've all been waiting for: are Democrats more knowledgeable than Republicans? When it comes to naming an economist and listing the three branches of government, the answer is: probably a little bit!
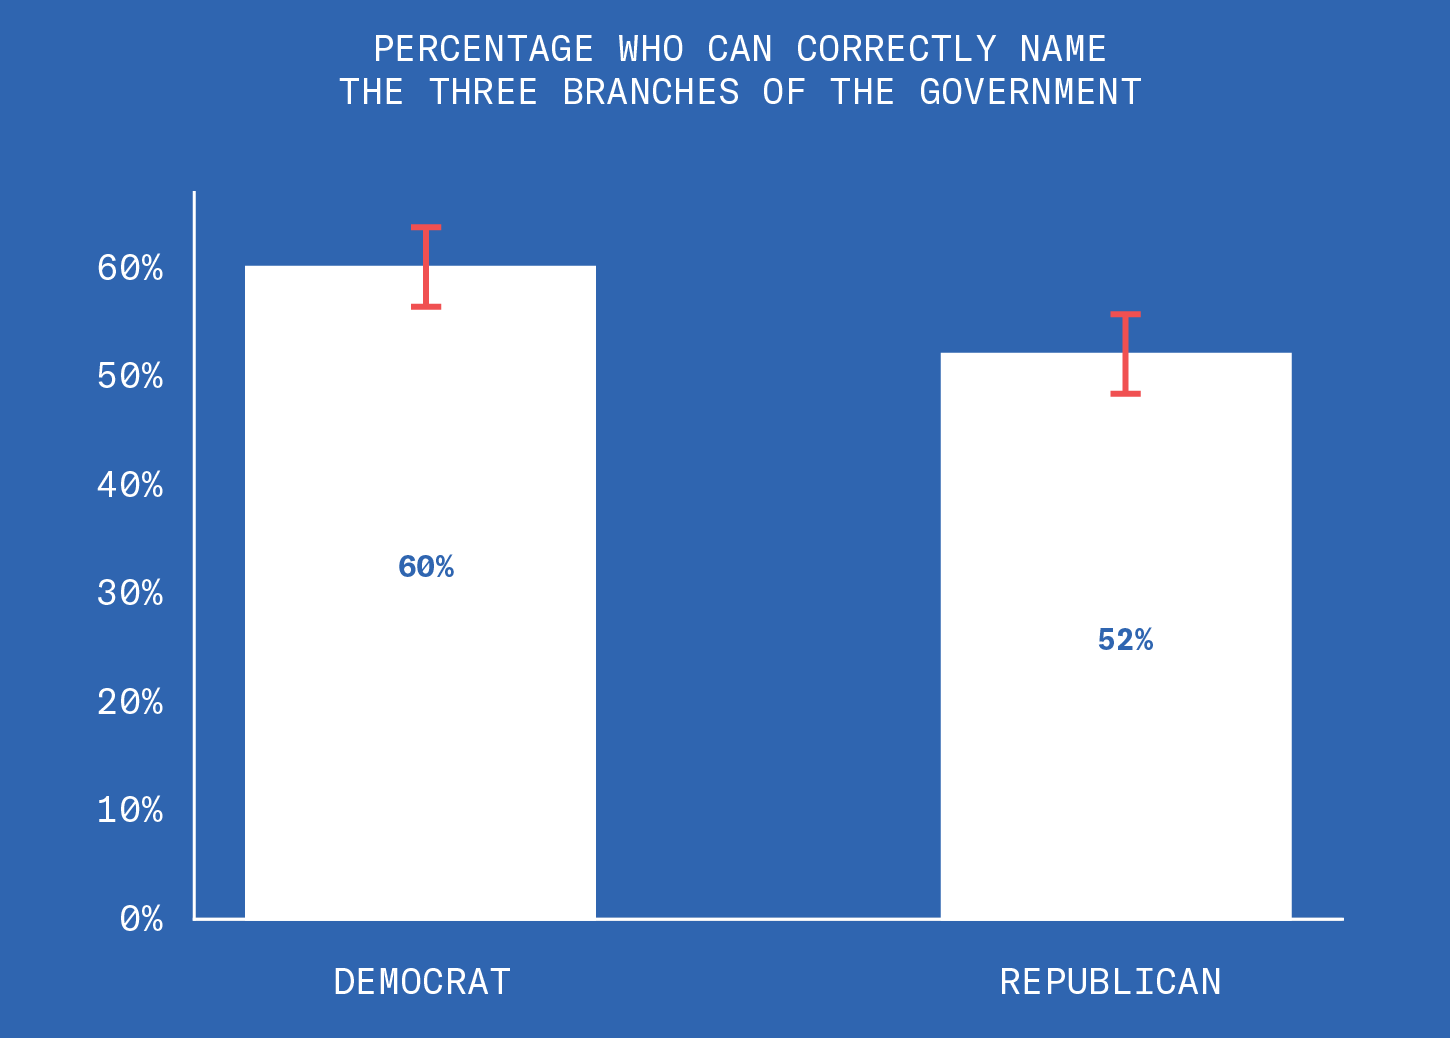
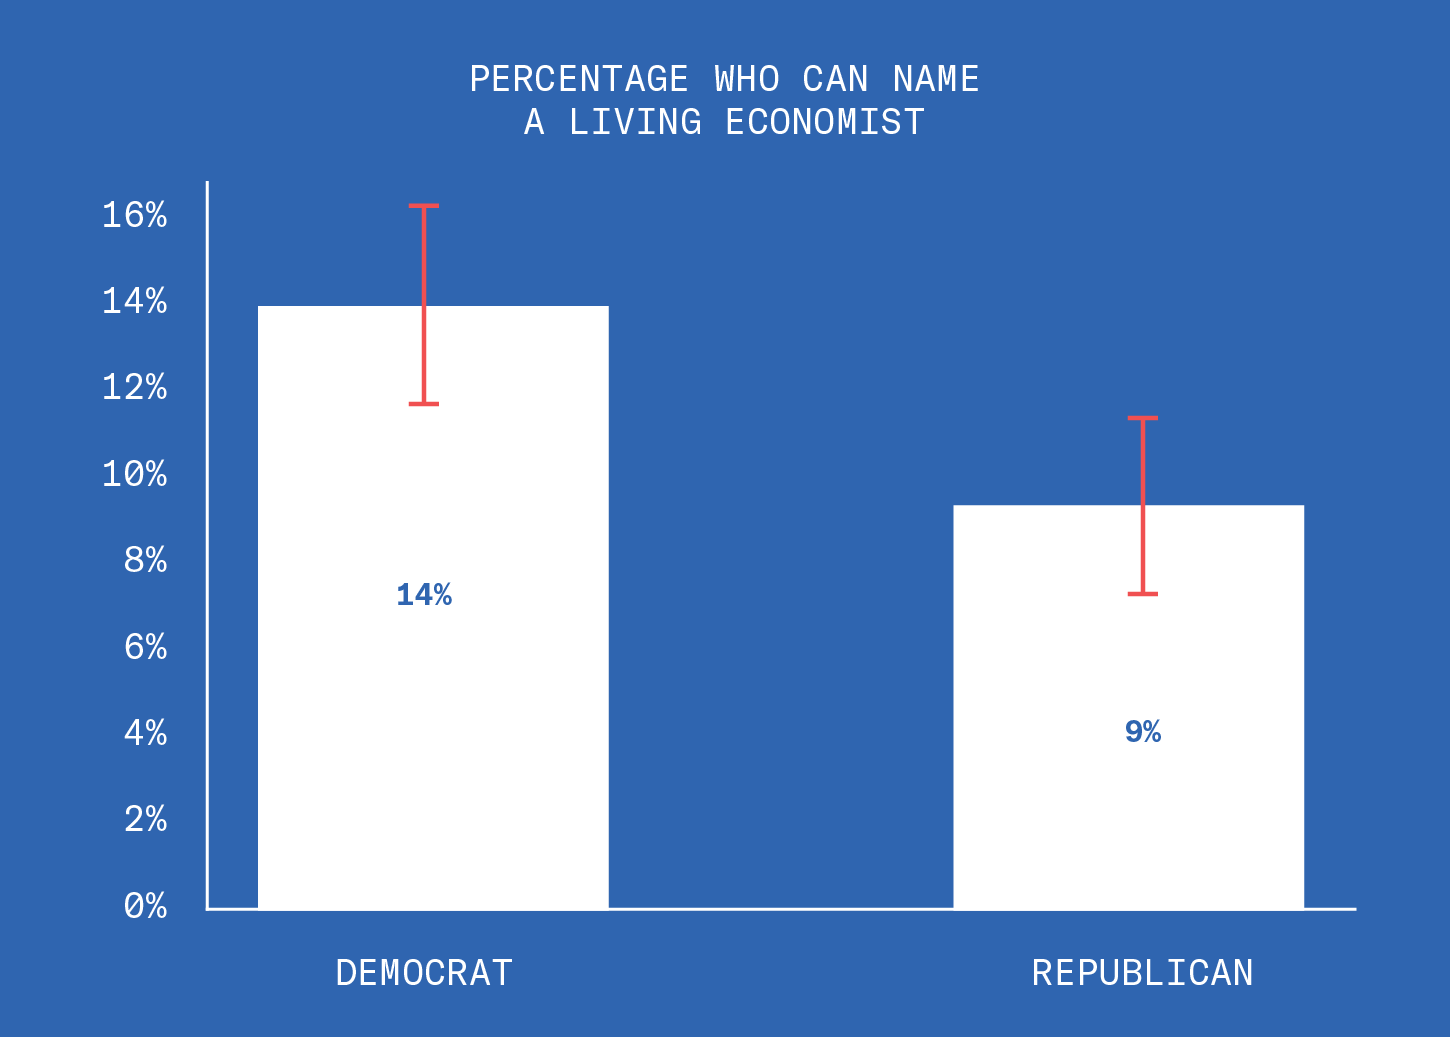
Red Team vs. Blue Team – 2 of 3
But when it comes to knowing that correlation does not prove causation, Democrats are just as stupid as Republicans.
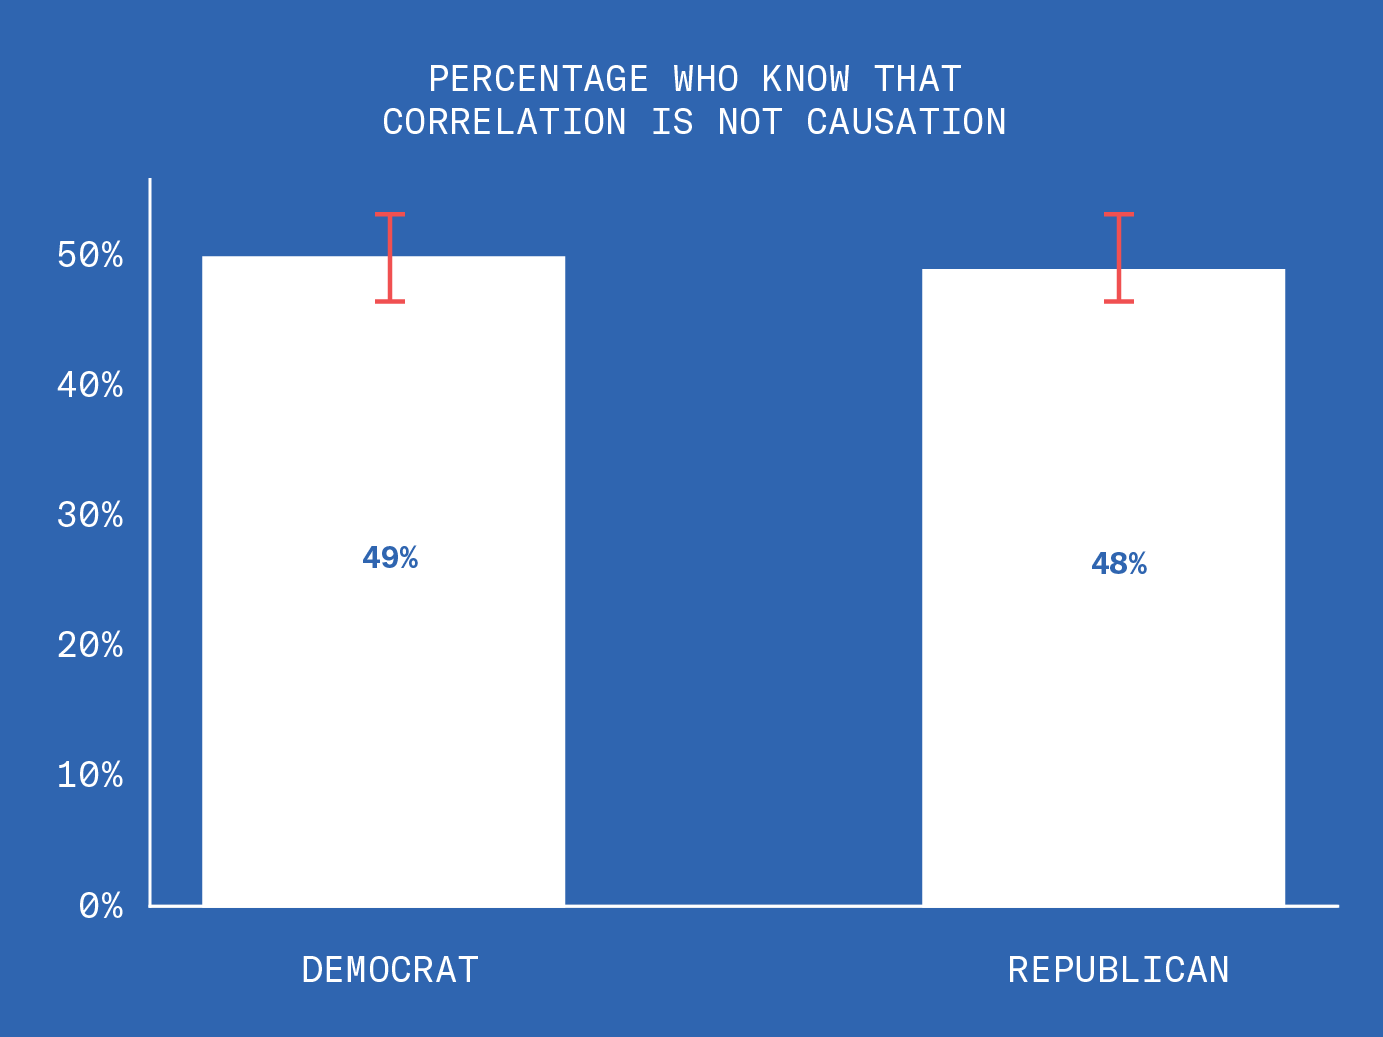
Red Team vs. Blue Team – 3 of 3
And contrary to the stereotype of smug liberals, Democrats are no more likely than Republicans to think of their opinions as well-informed.
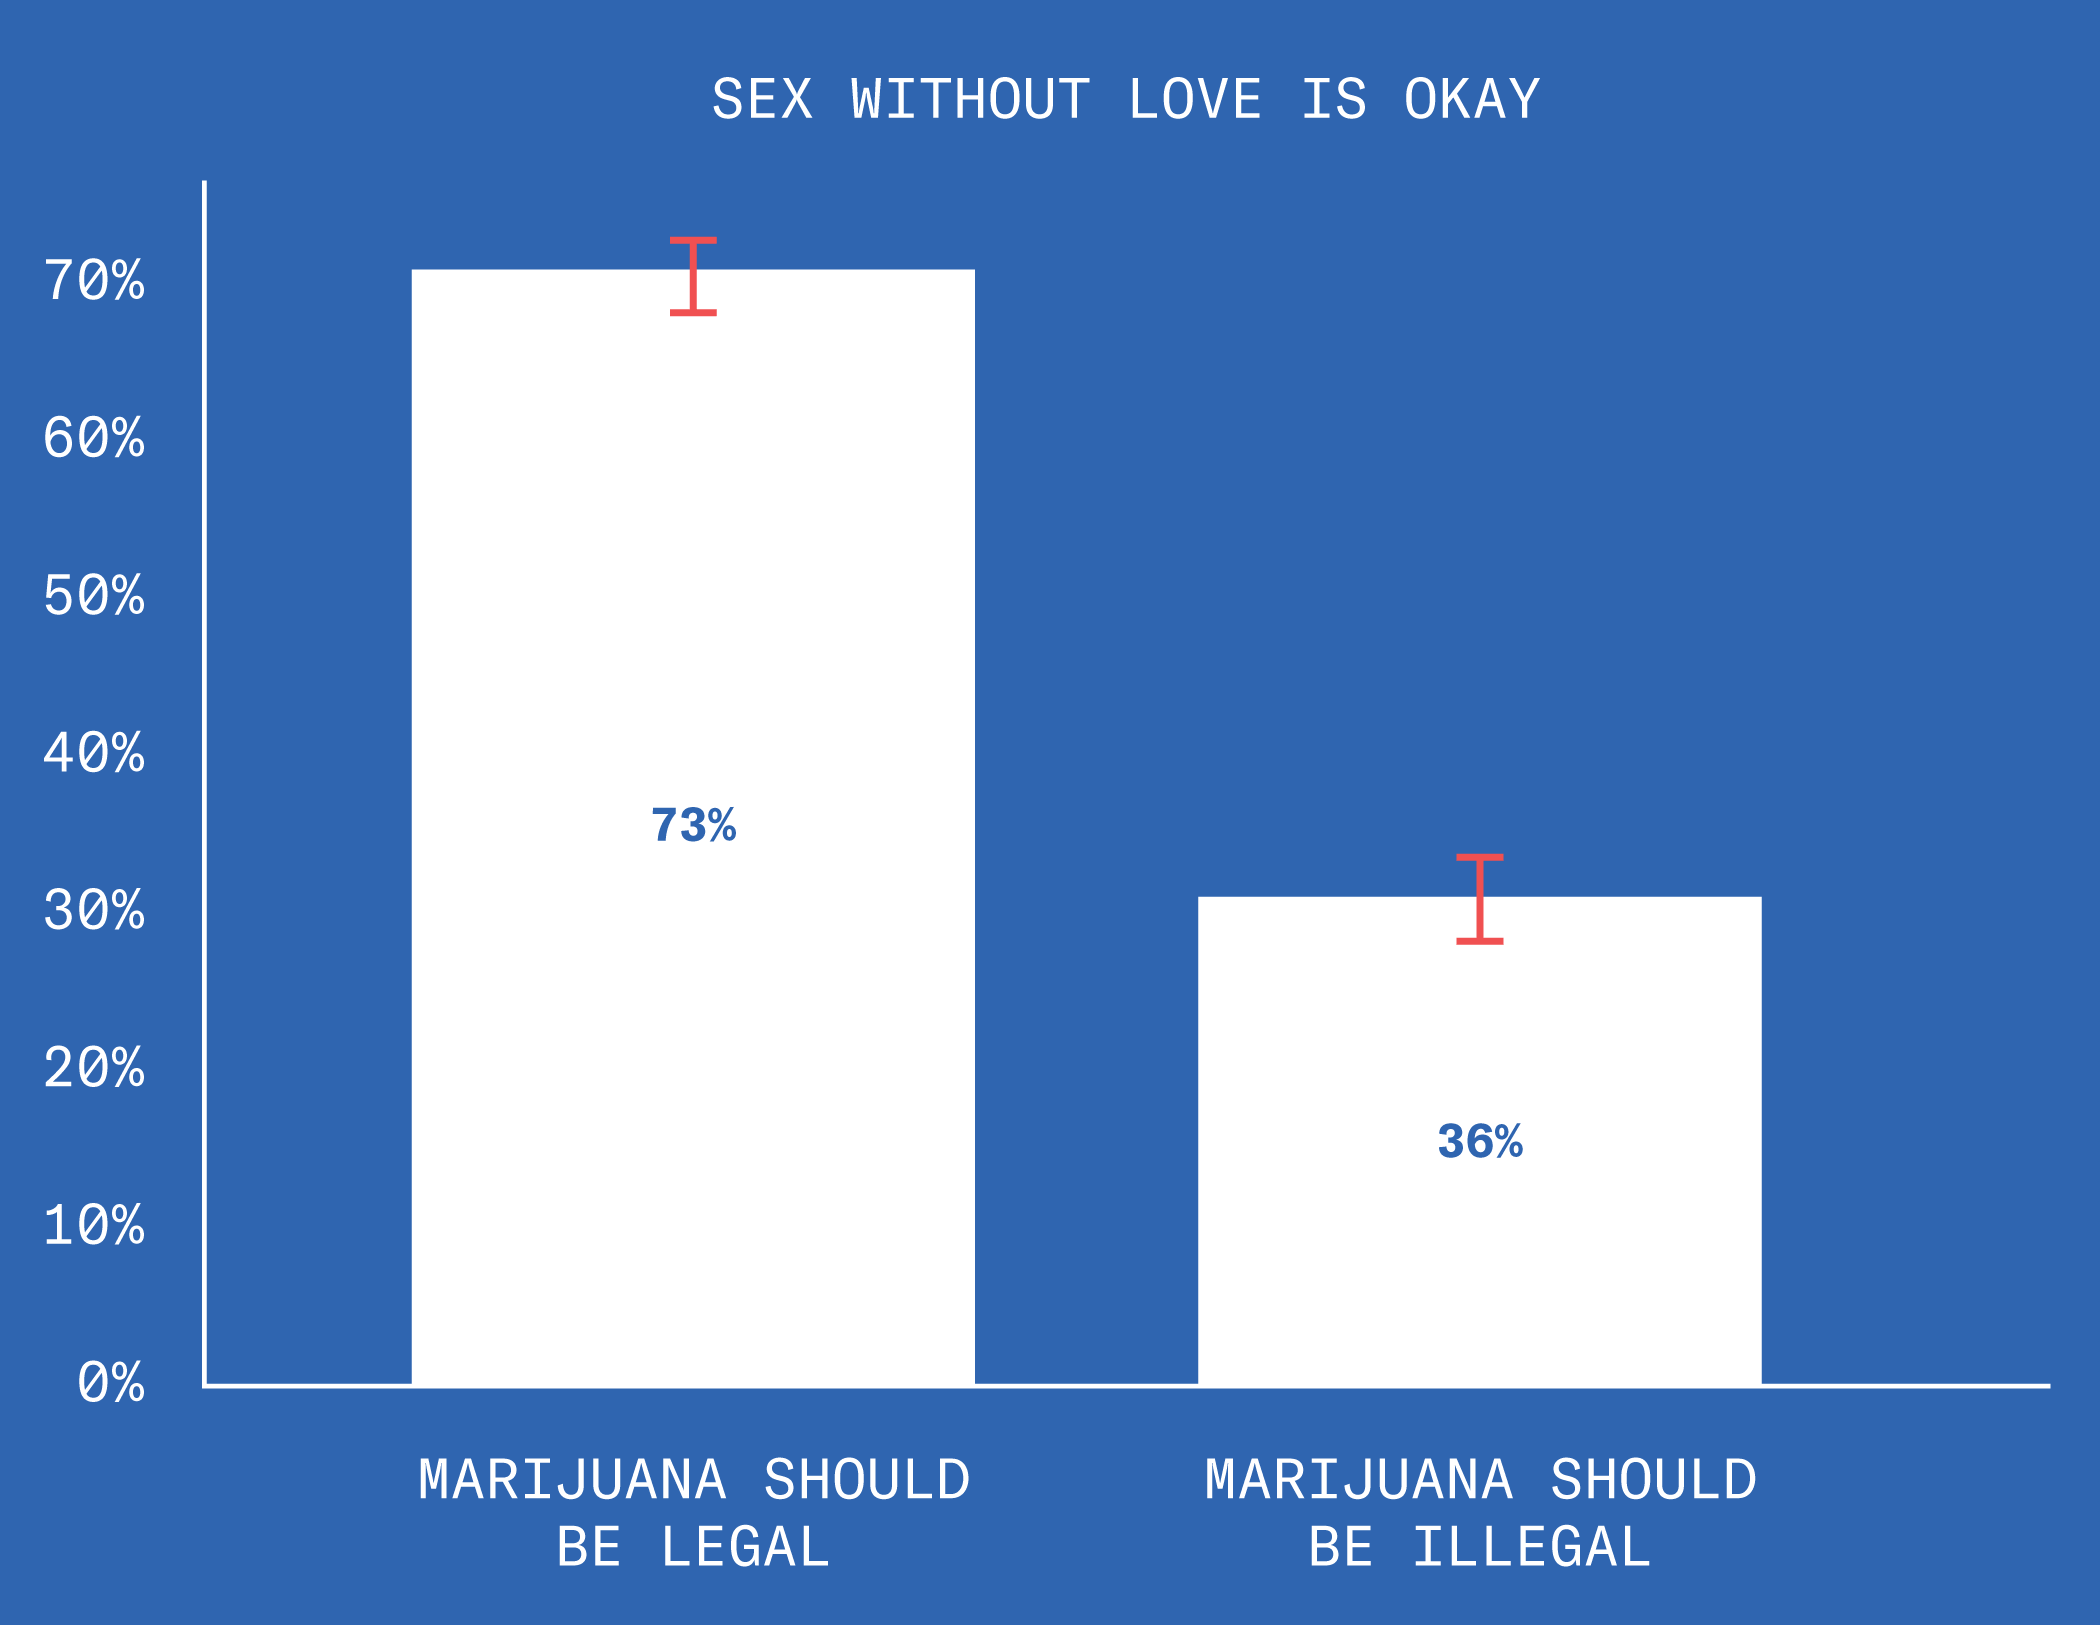
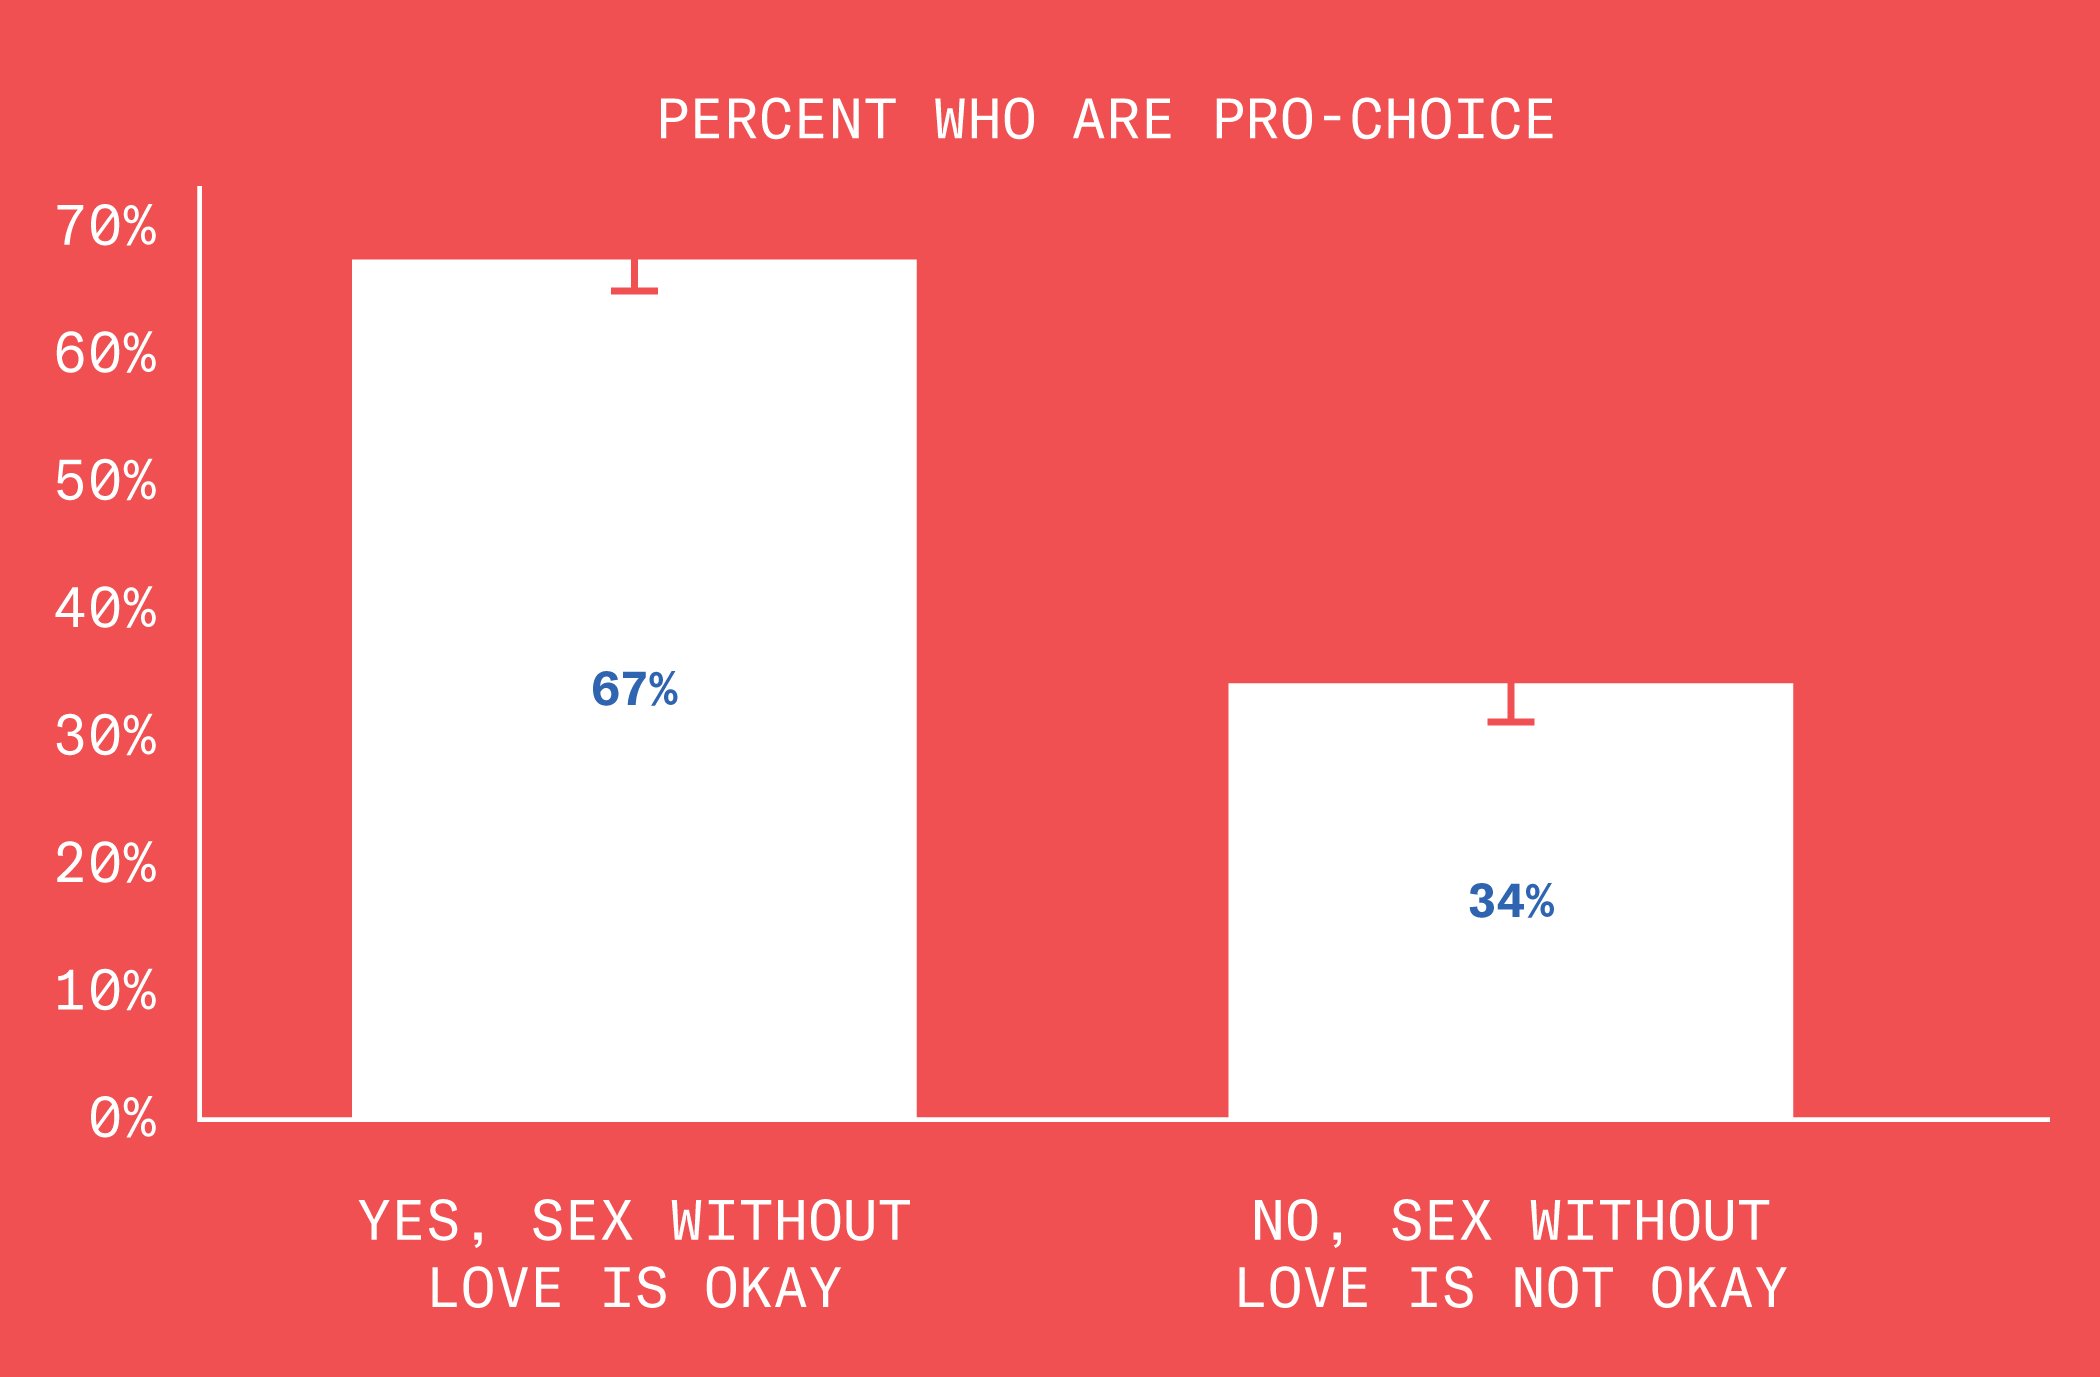
Sex Without Love
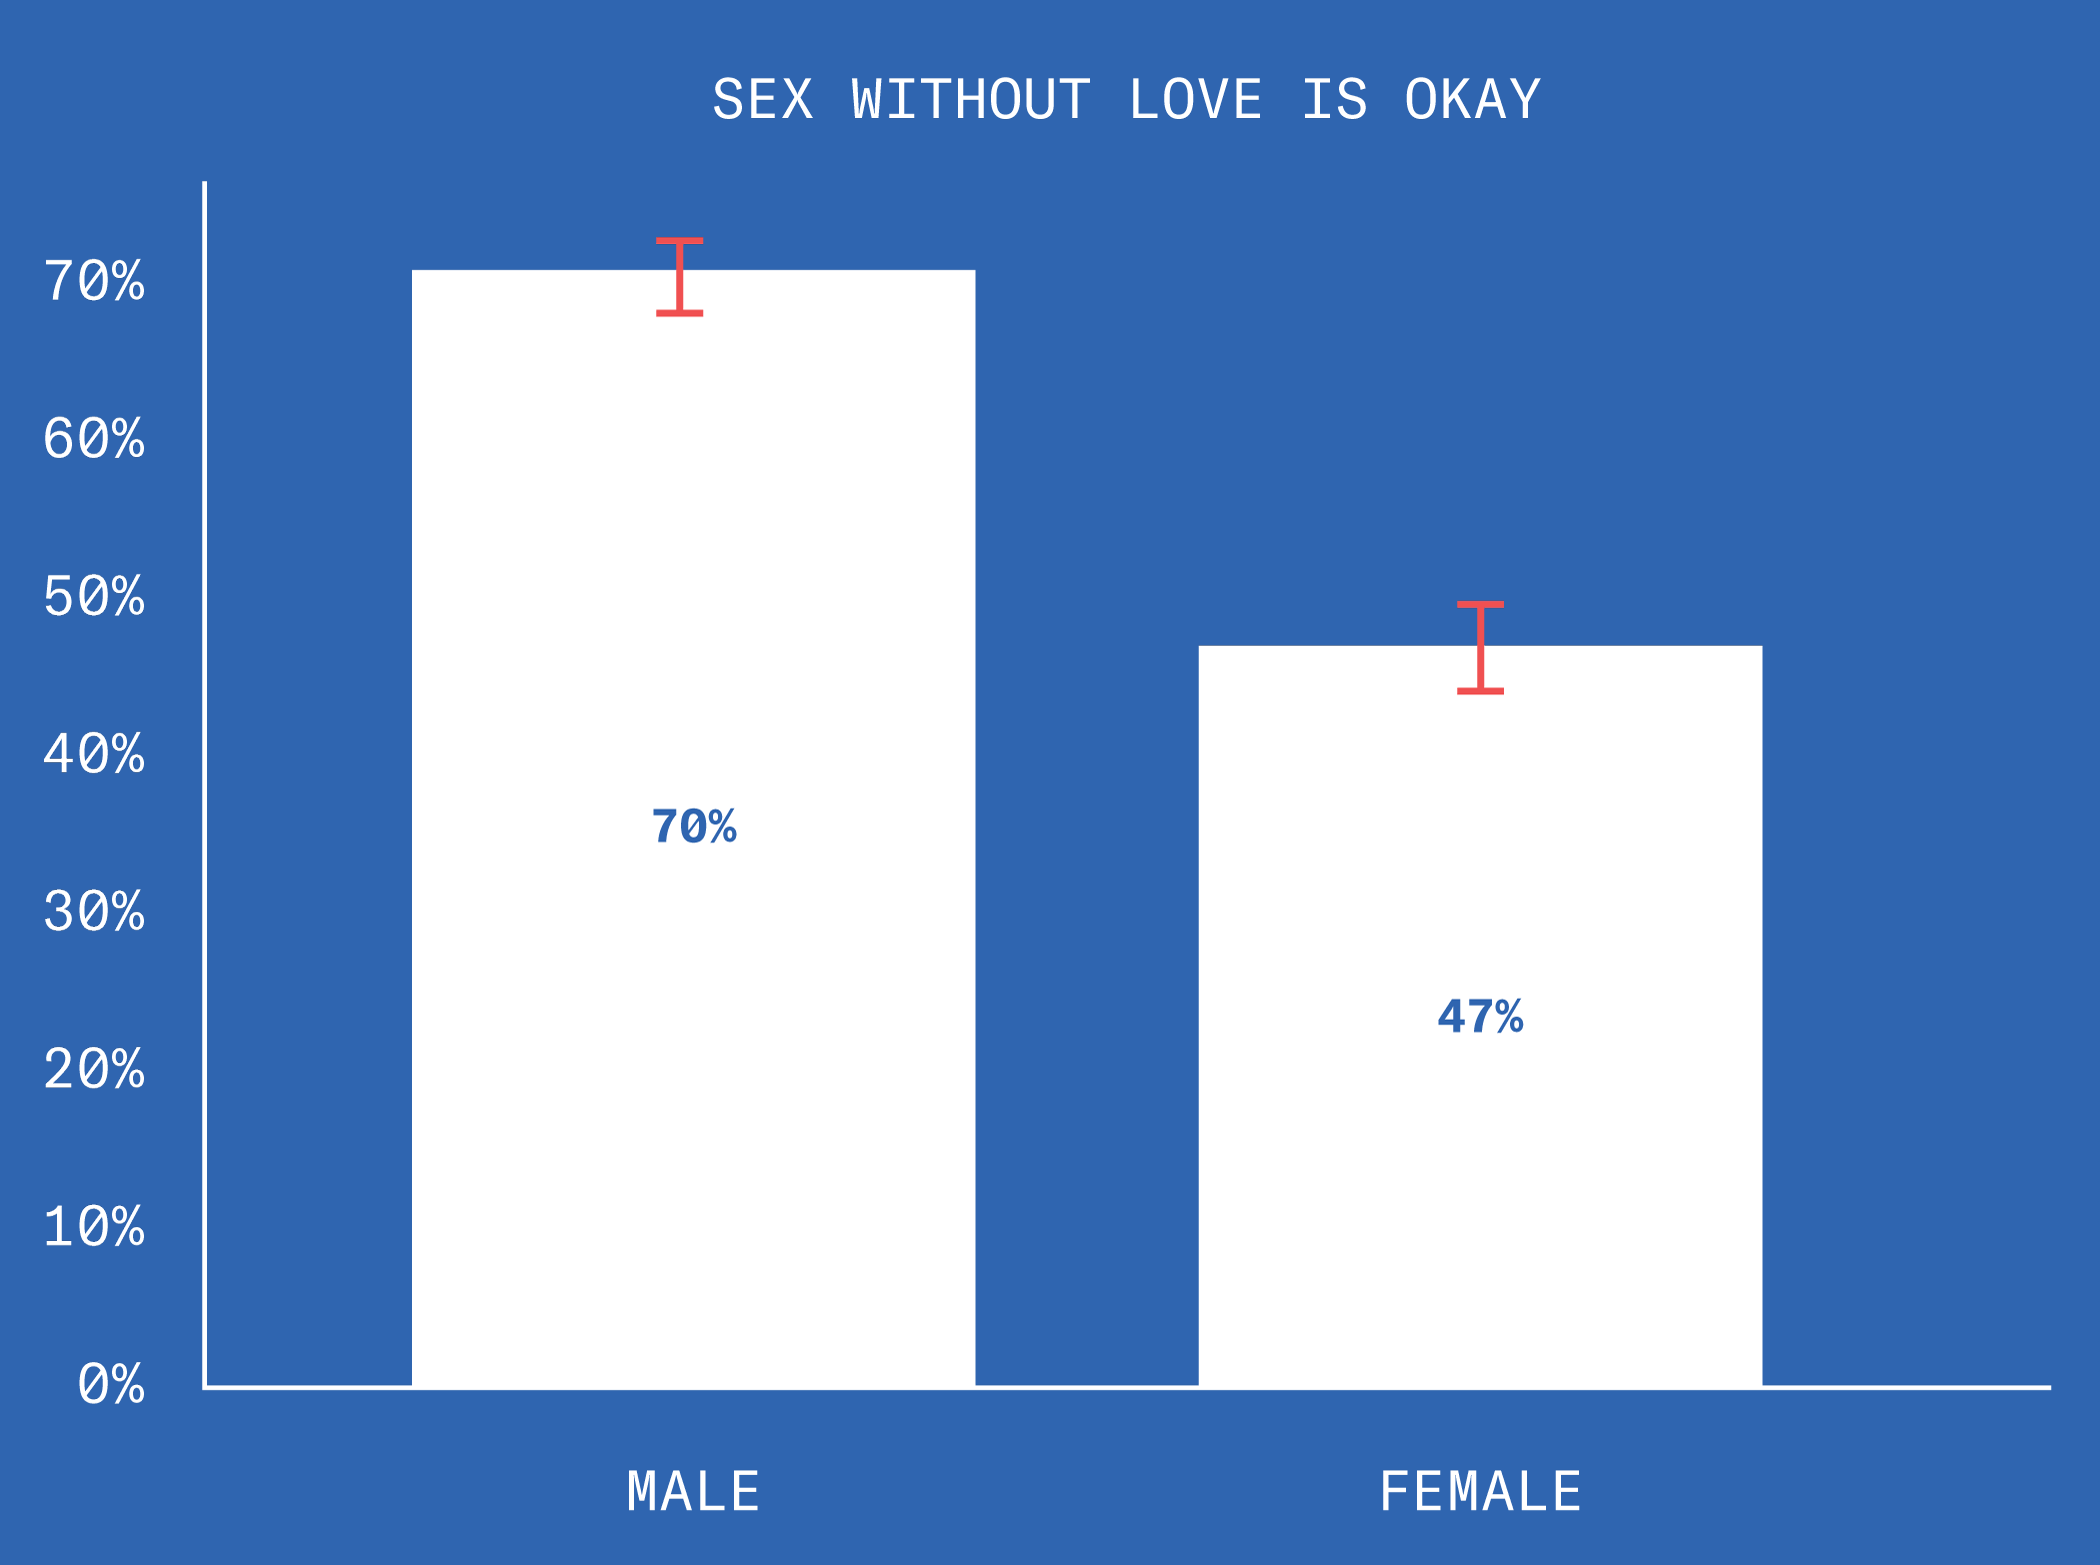
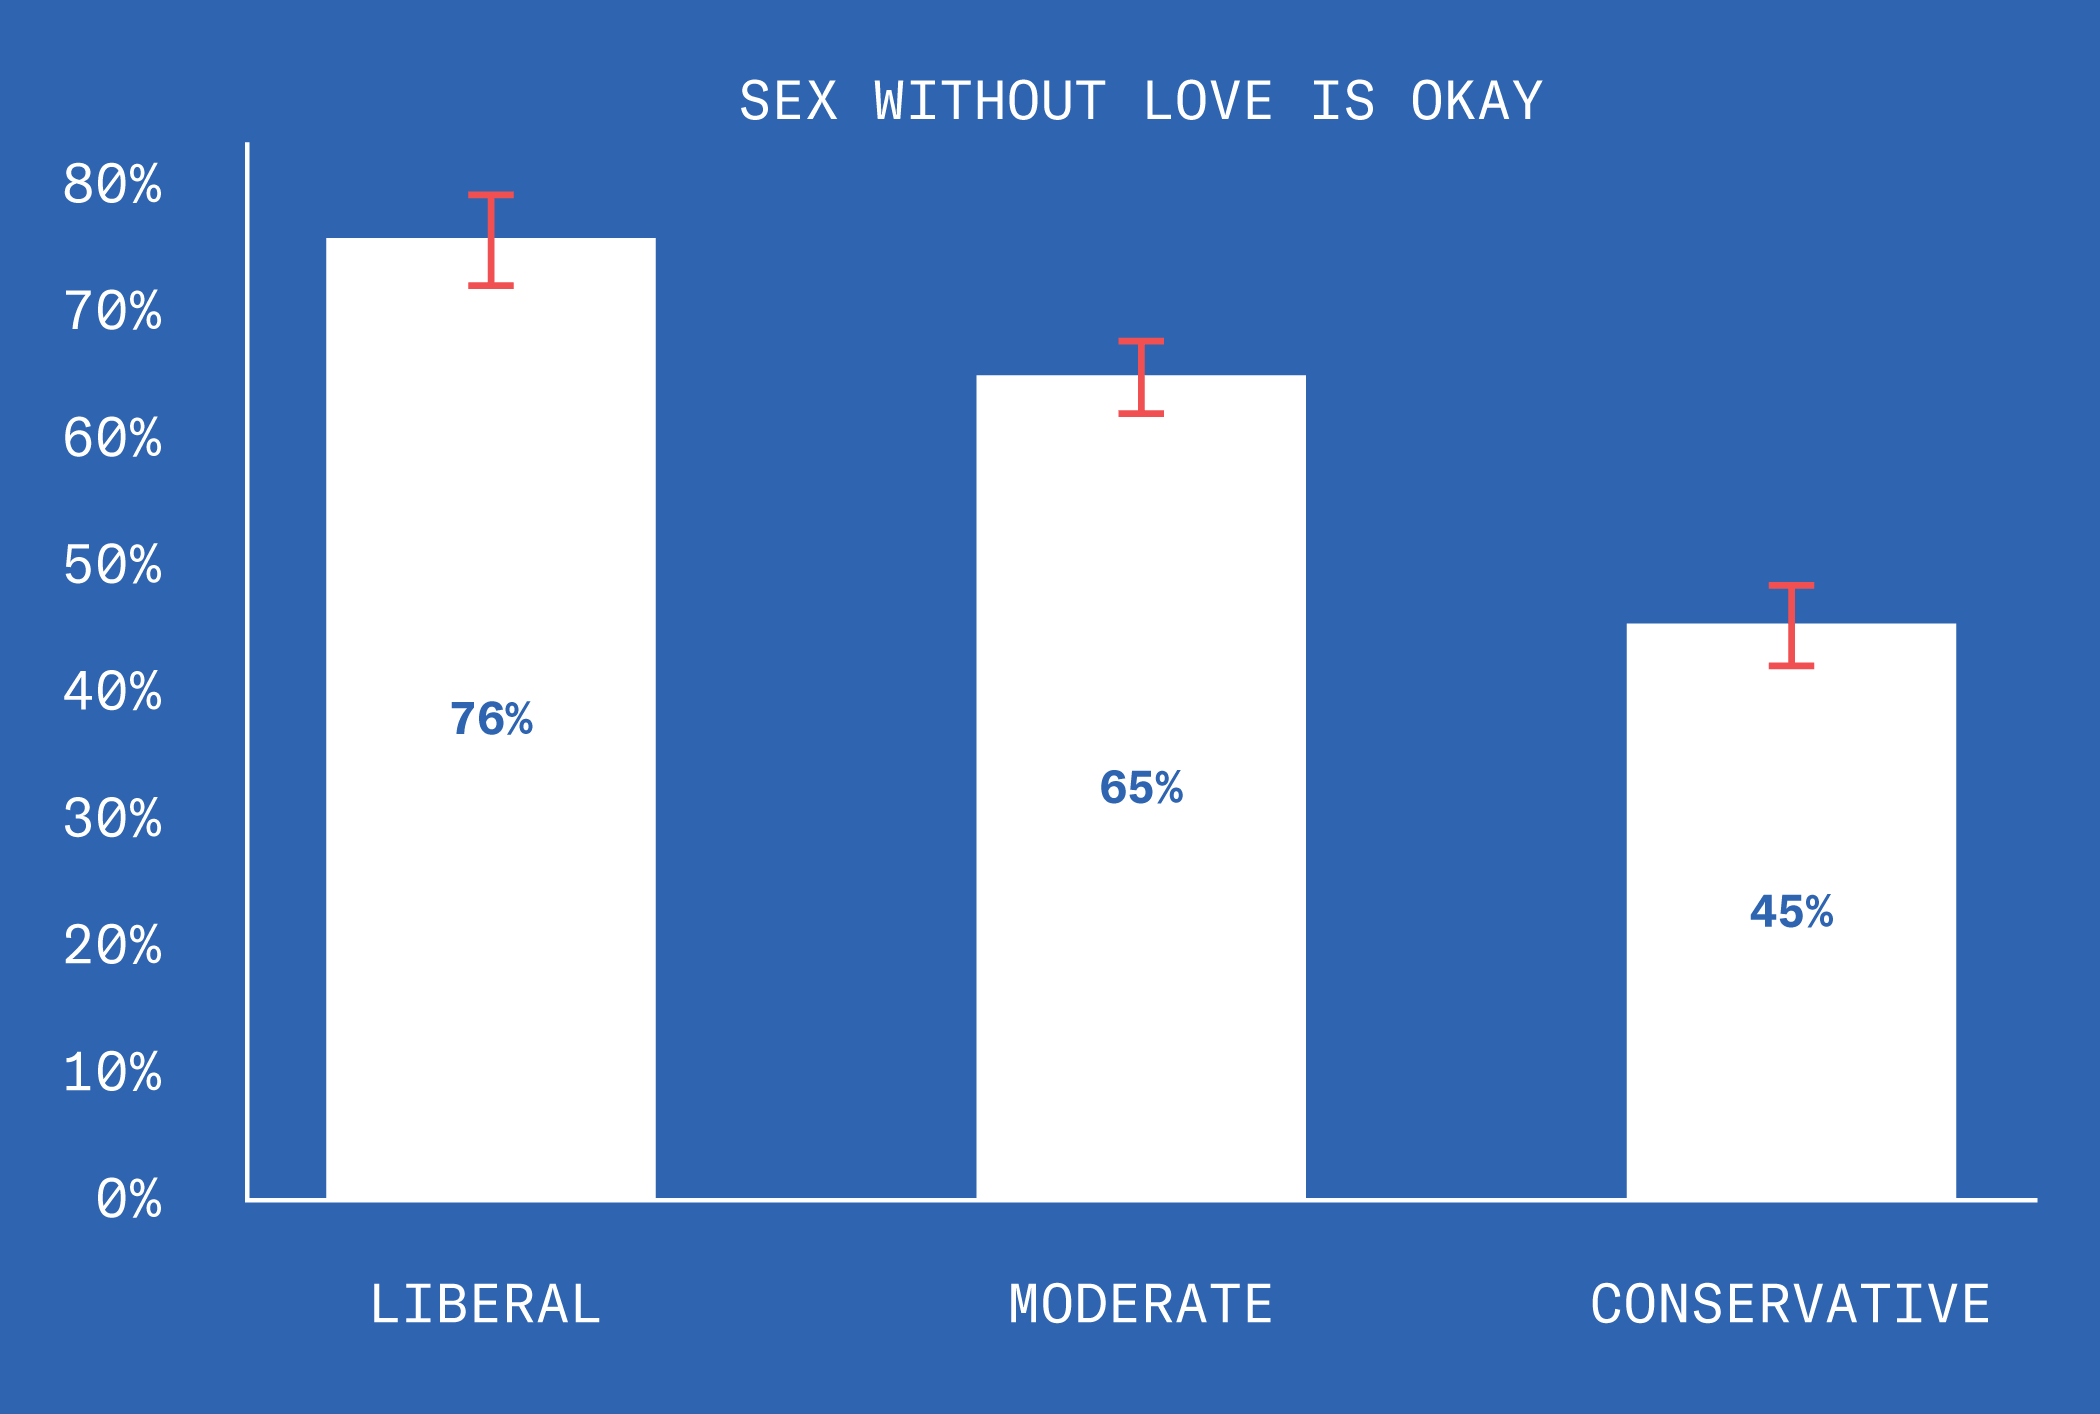
This month’s poll was about everyone’s favorite topic: sex. We started off with a simple question. Is sex without love okay?

Sex Without Love – 2 of 5
As you might have guessed, people who say yes tend to be liberal, male, and more supportive of legalizing weed.
Sex Without Love – 3 of 5
Sex Without Love – 4 of 5
Sex Without Love – 5 of 5
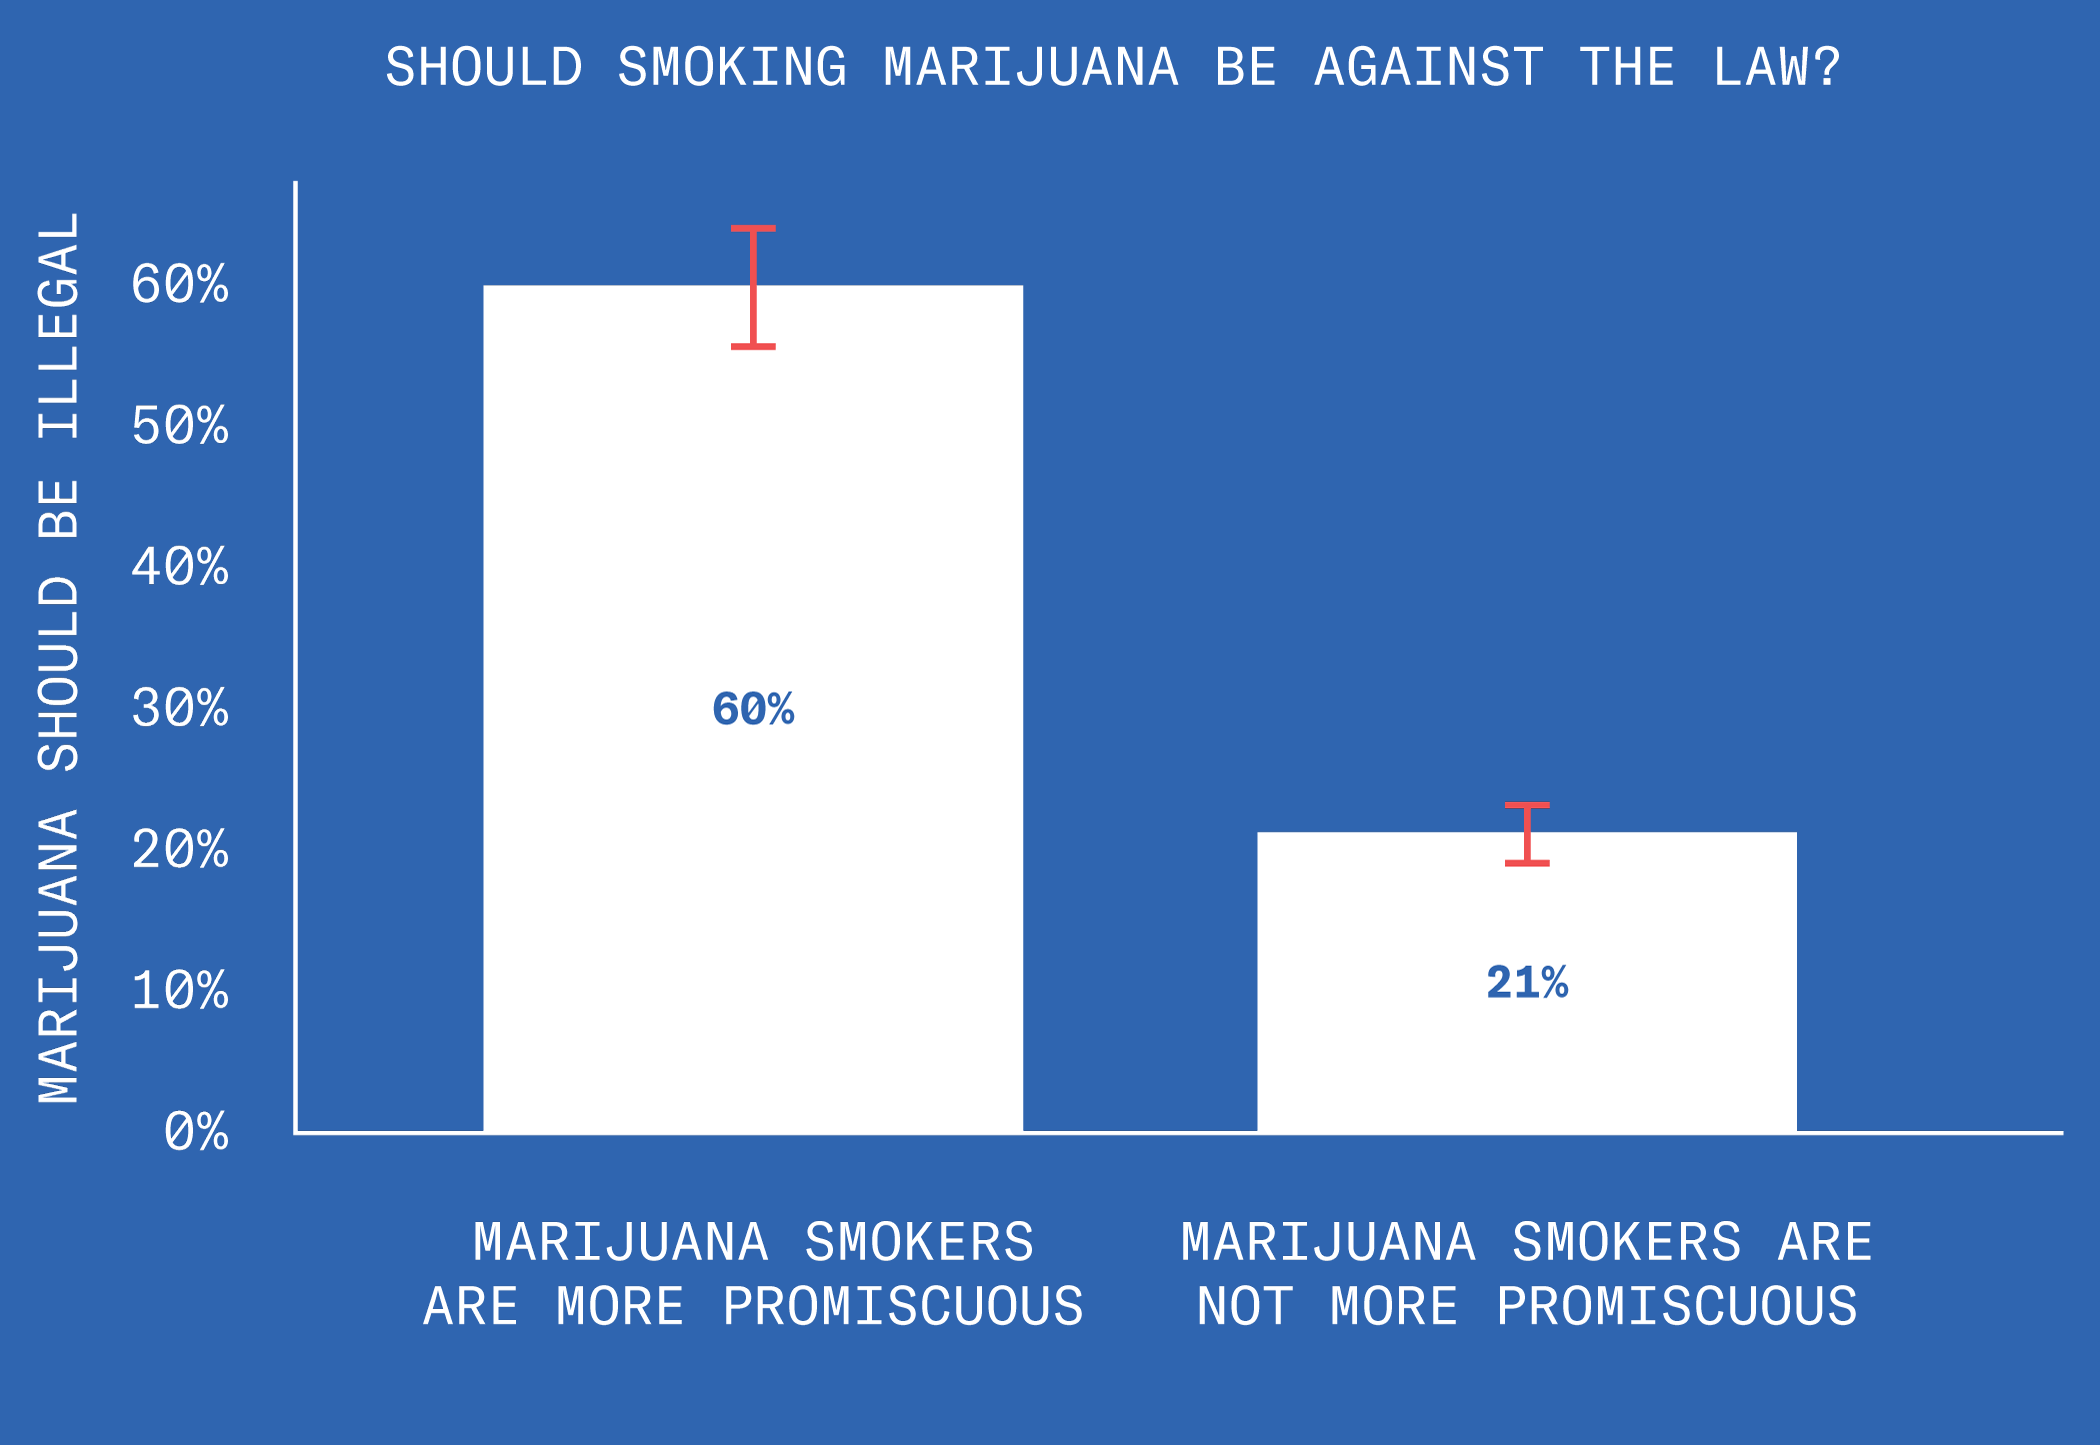
What does sex have to do with legalizing weed? To find out, we asked people if they thought marijuana smokers were more promiscuous than non-smokers. The people who said yes were three times more likely to oppose legalizing weed.
Abortion
It’s time for America’s favorite medical procedure: abortion.
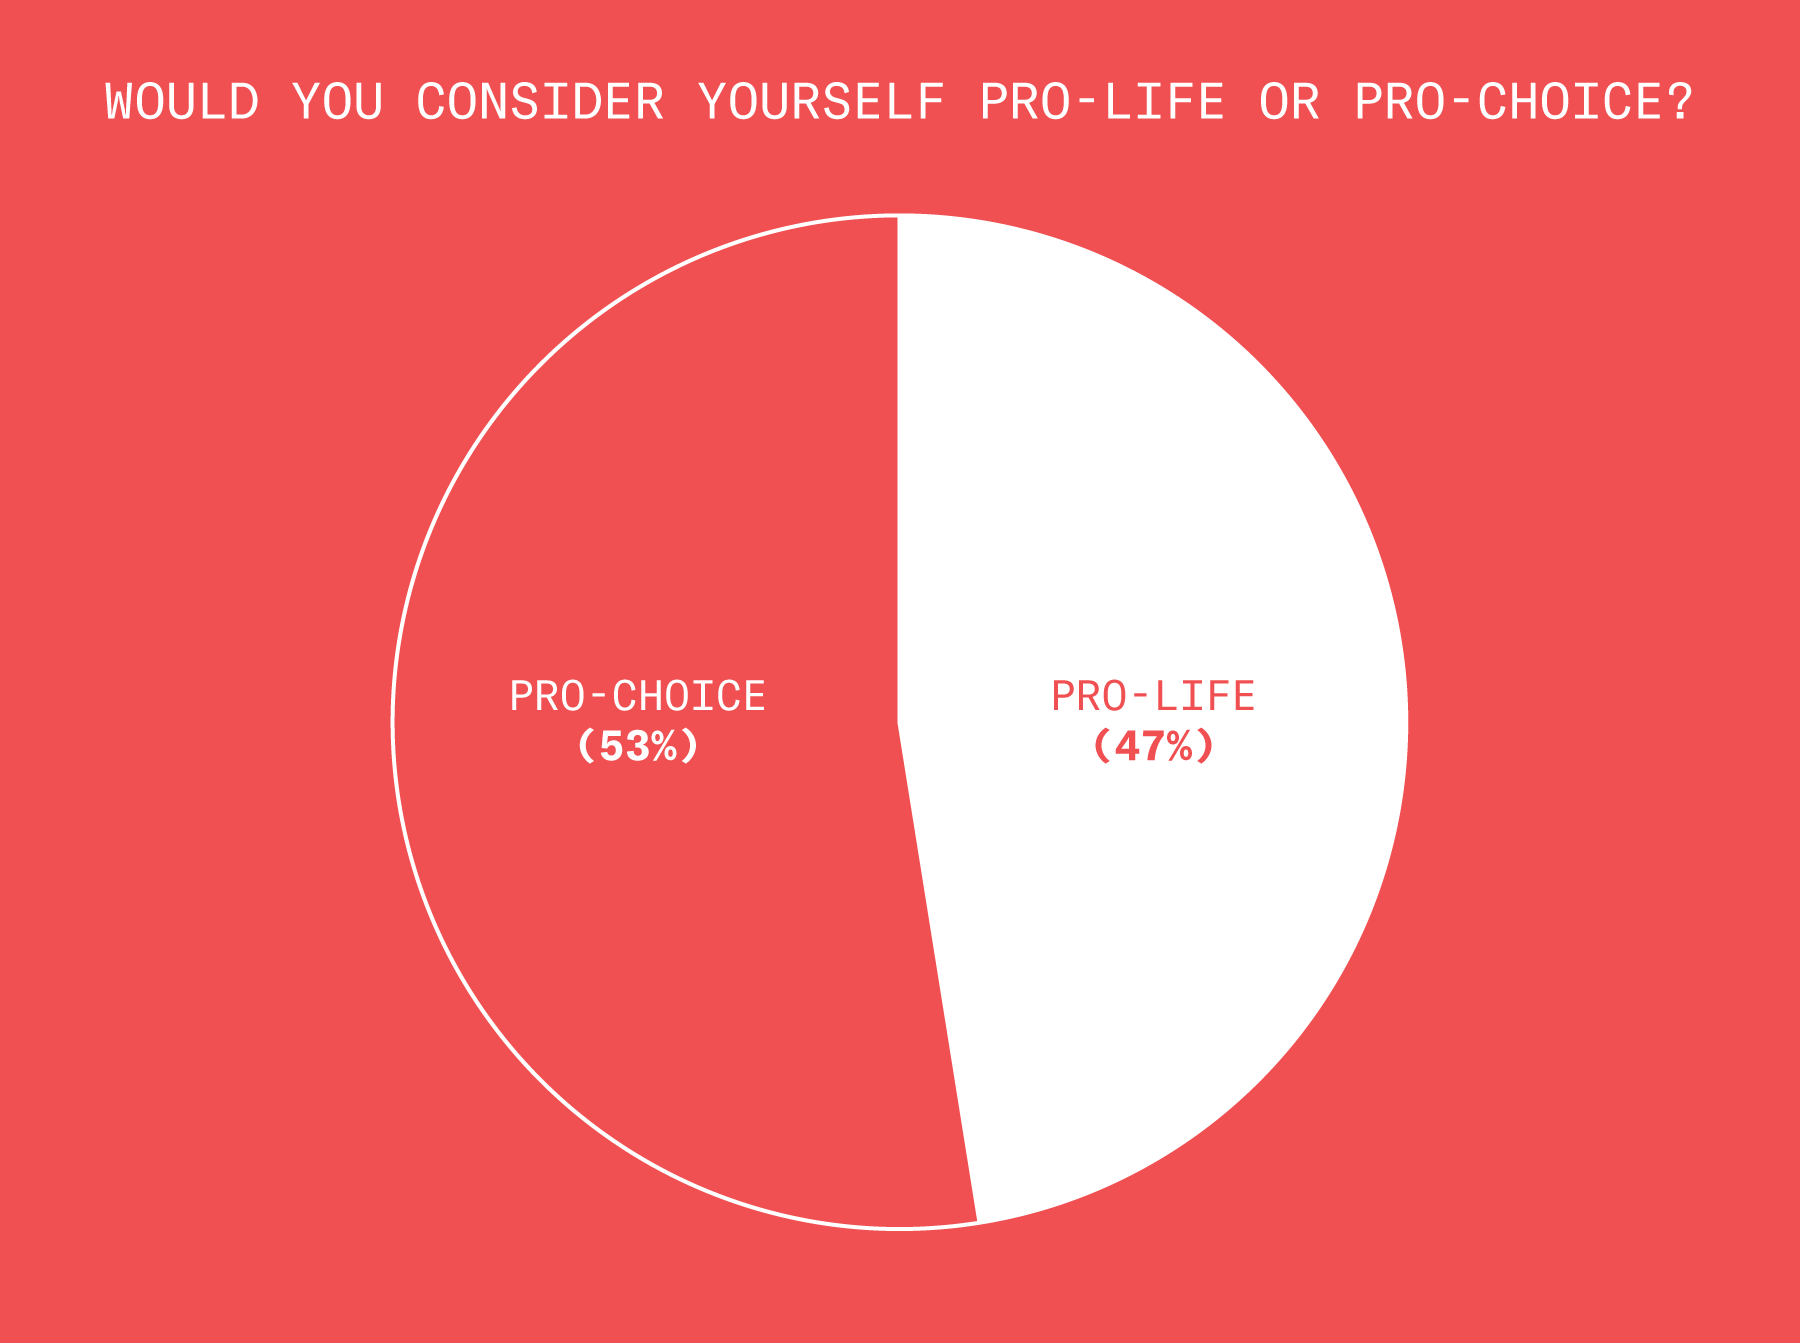
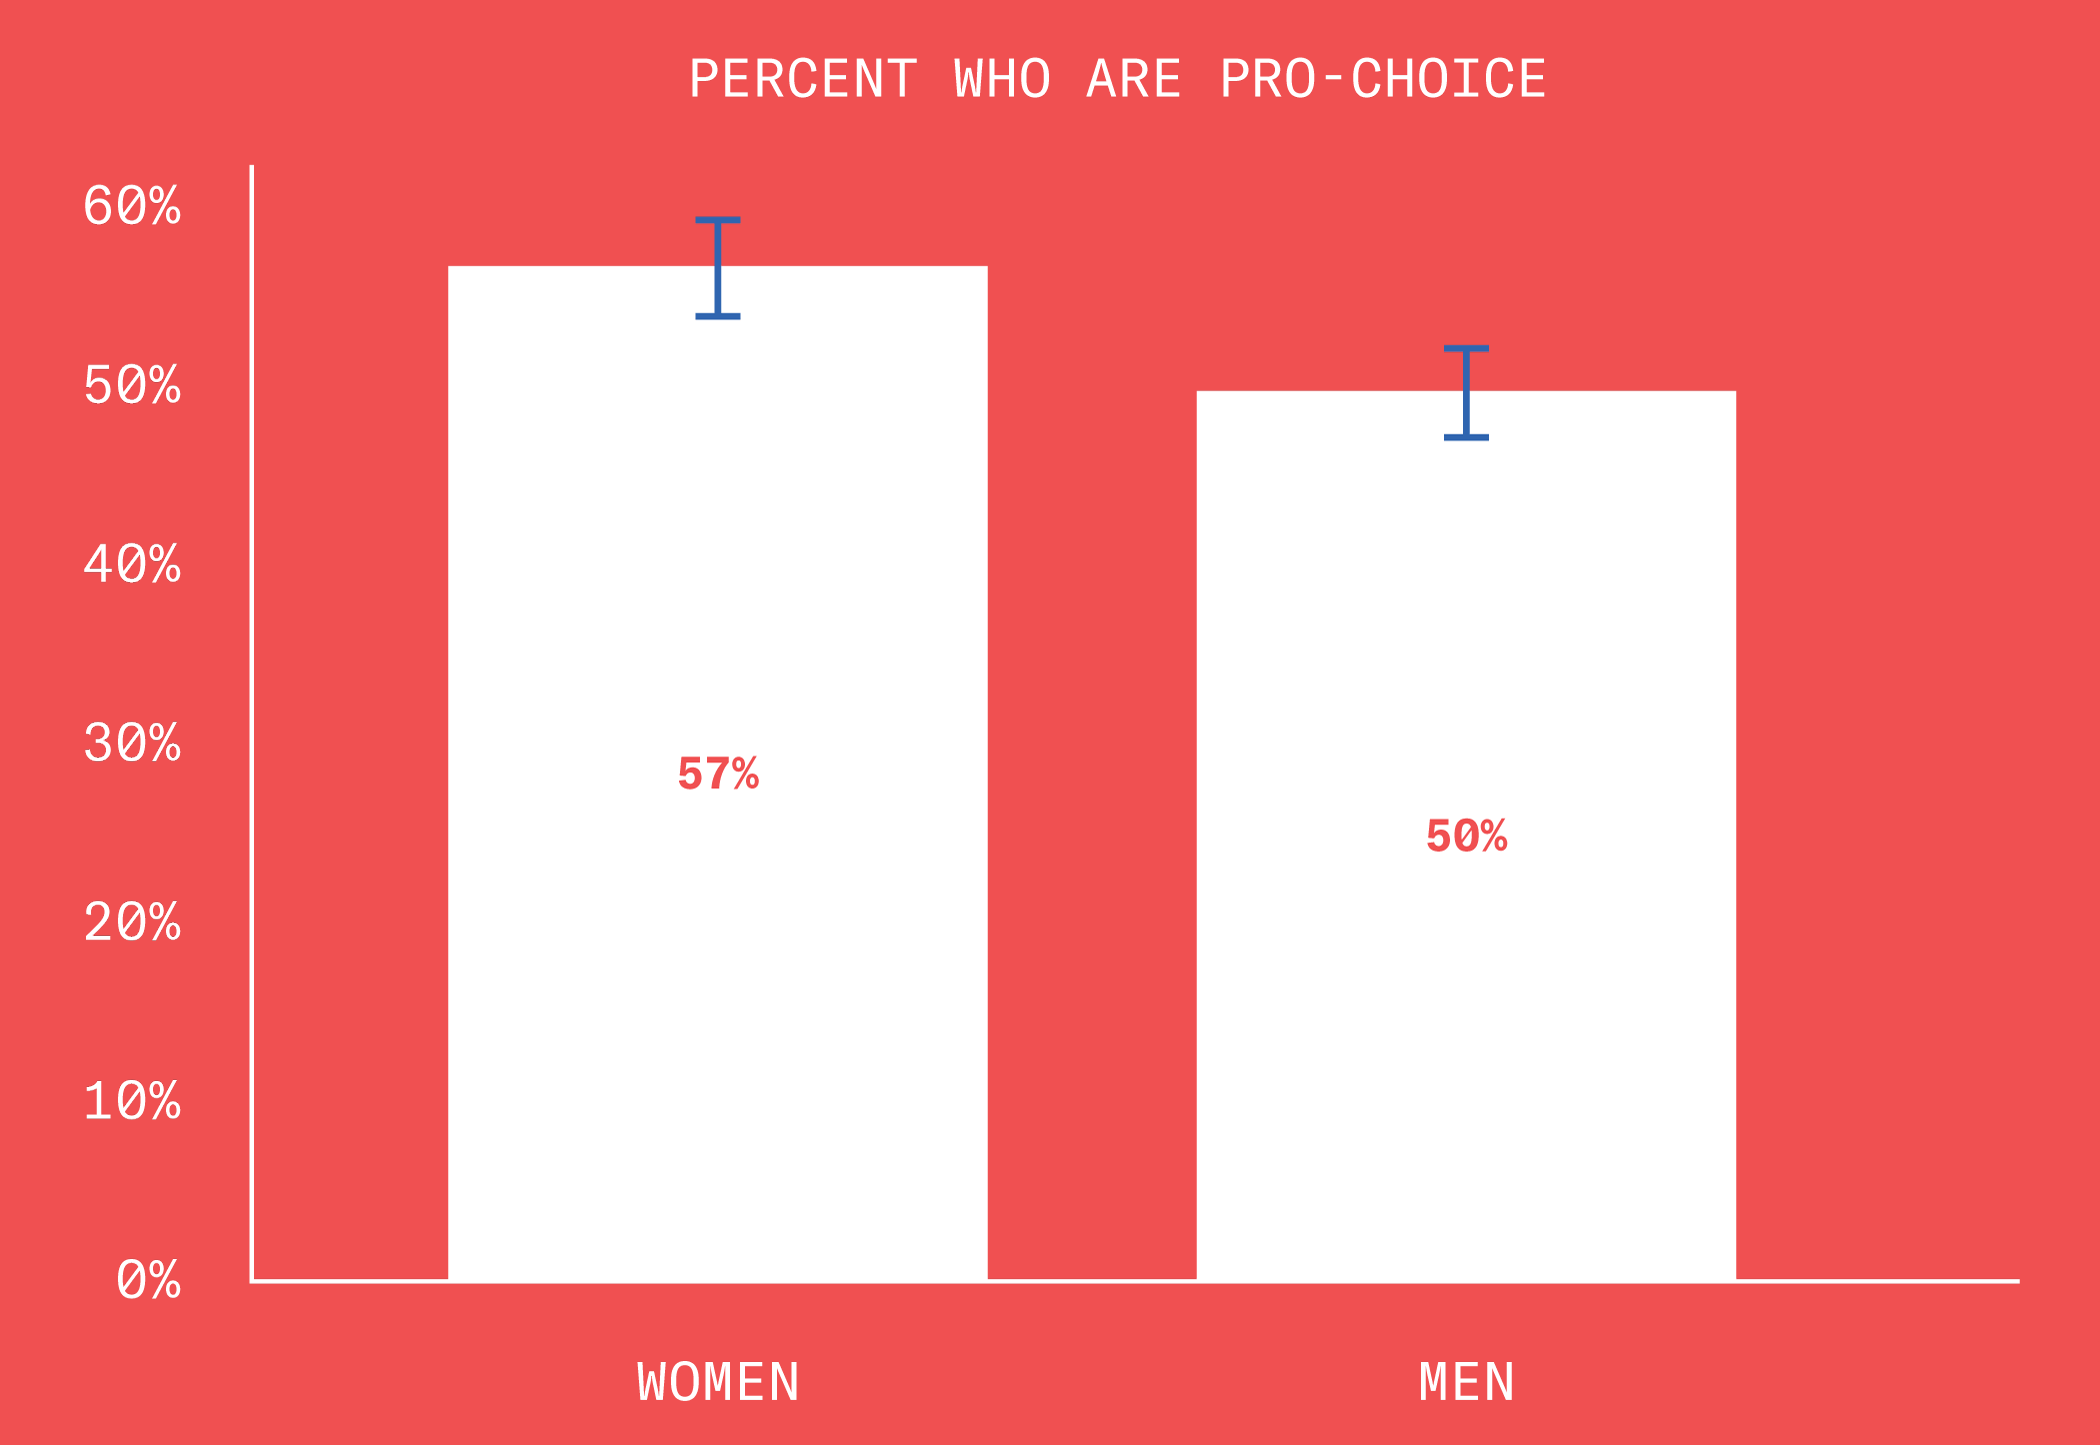
Abortion – 2 of 3
Contrary to what you might expect, women aren’t much more likely to be pro-choice than men.
Abortion – 3 of 3
If you want to know a person’s views on abortion, ask them if sex without love is okay.
And that about does it for abortion!
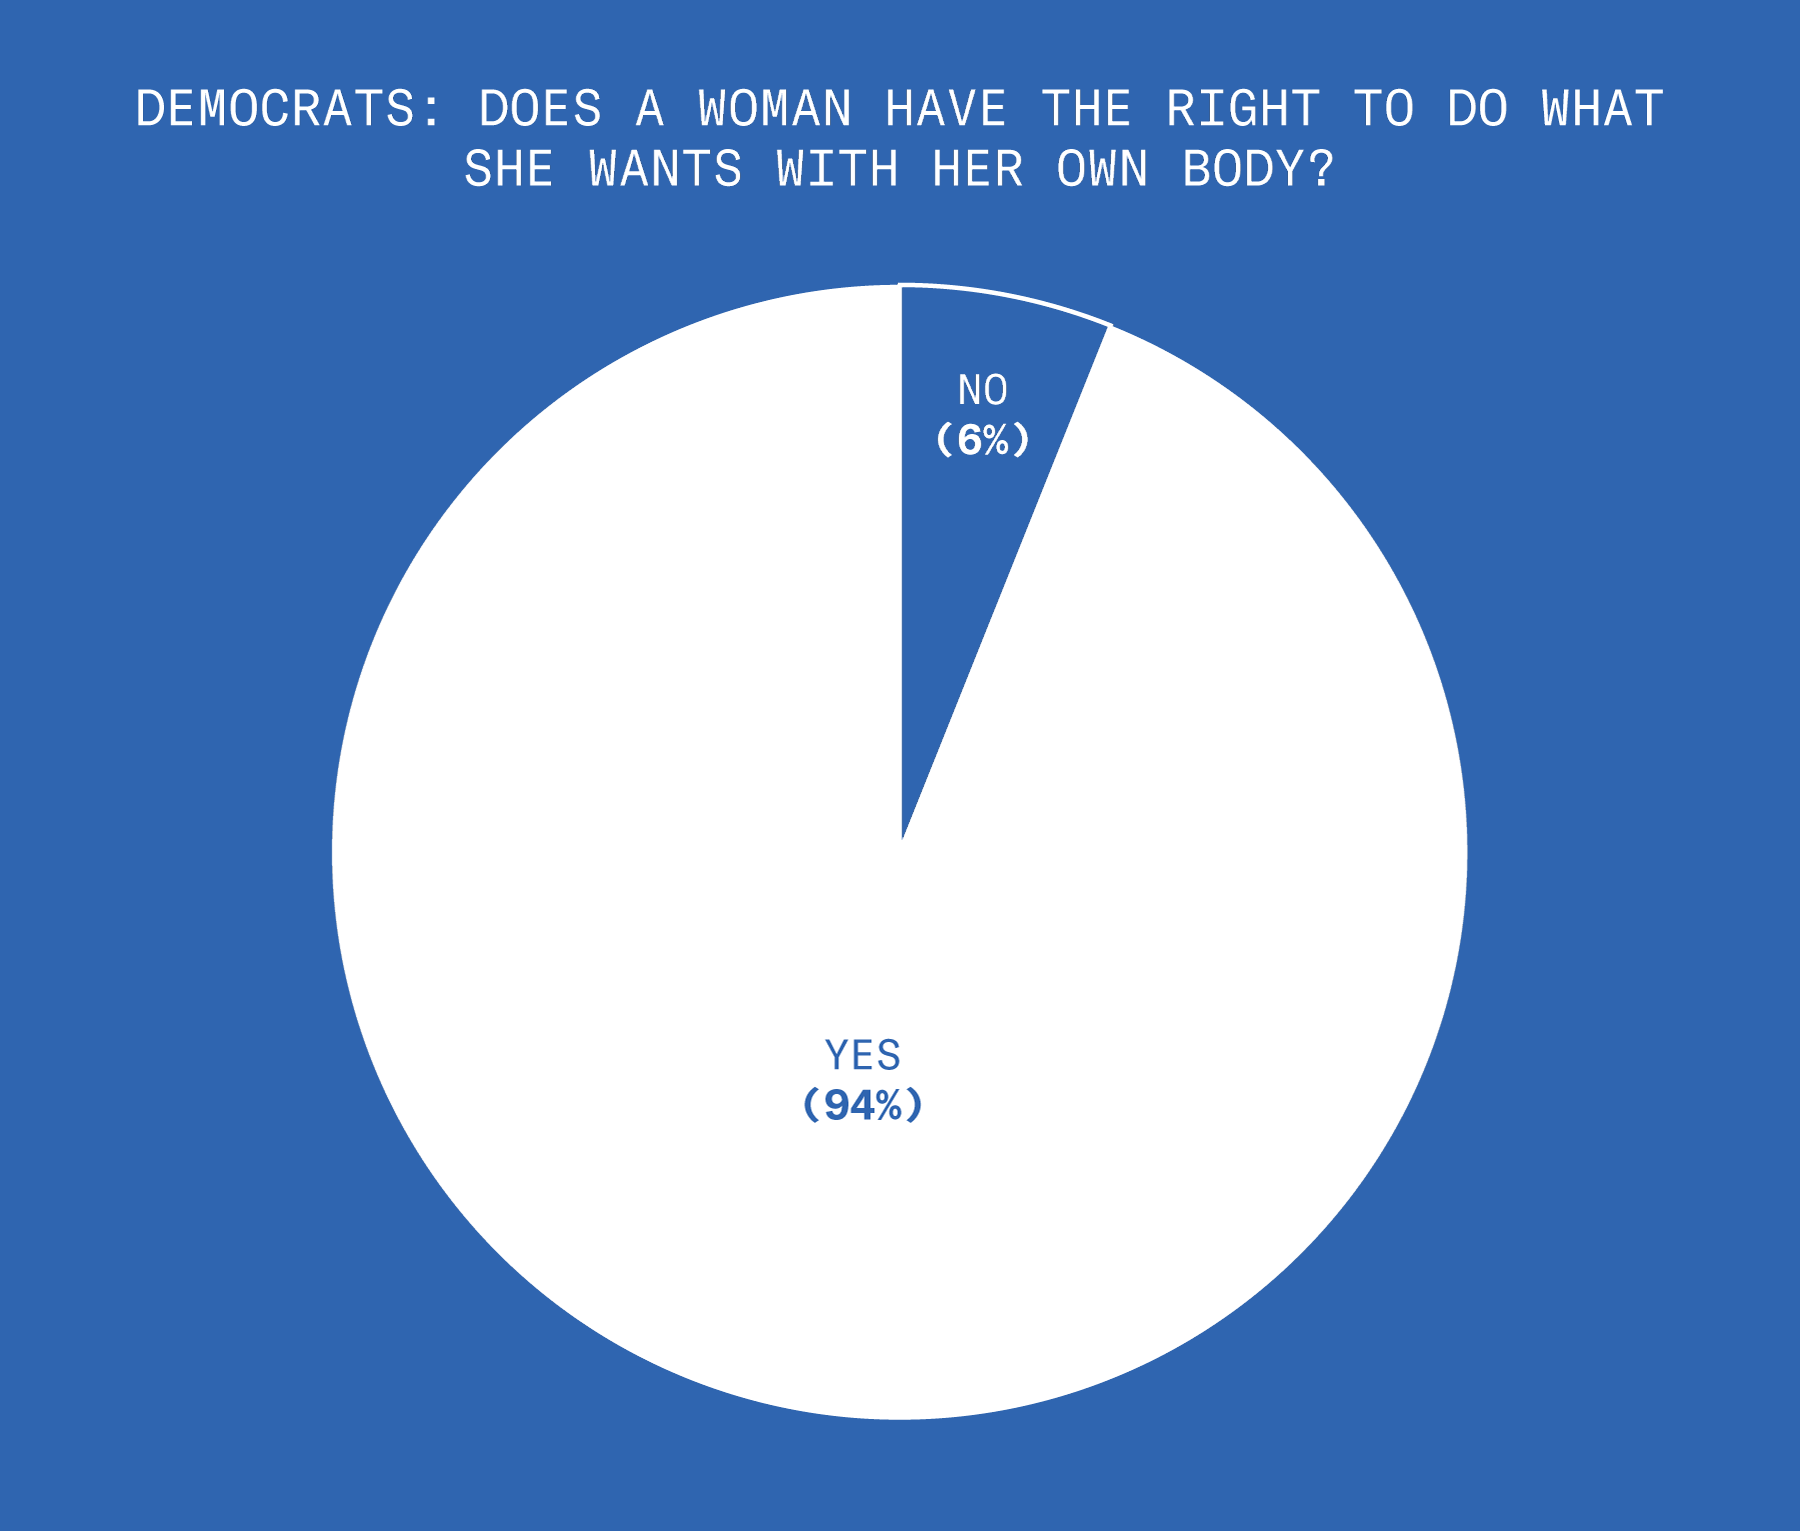
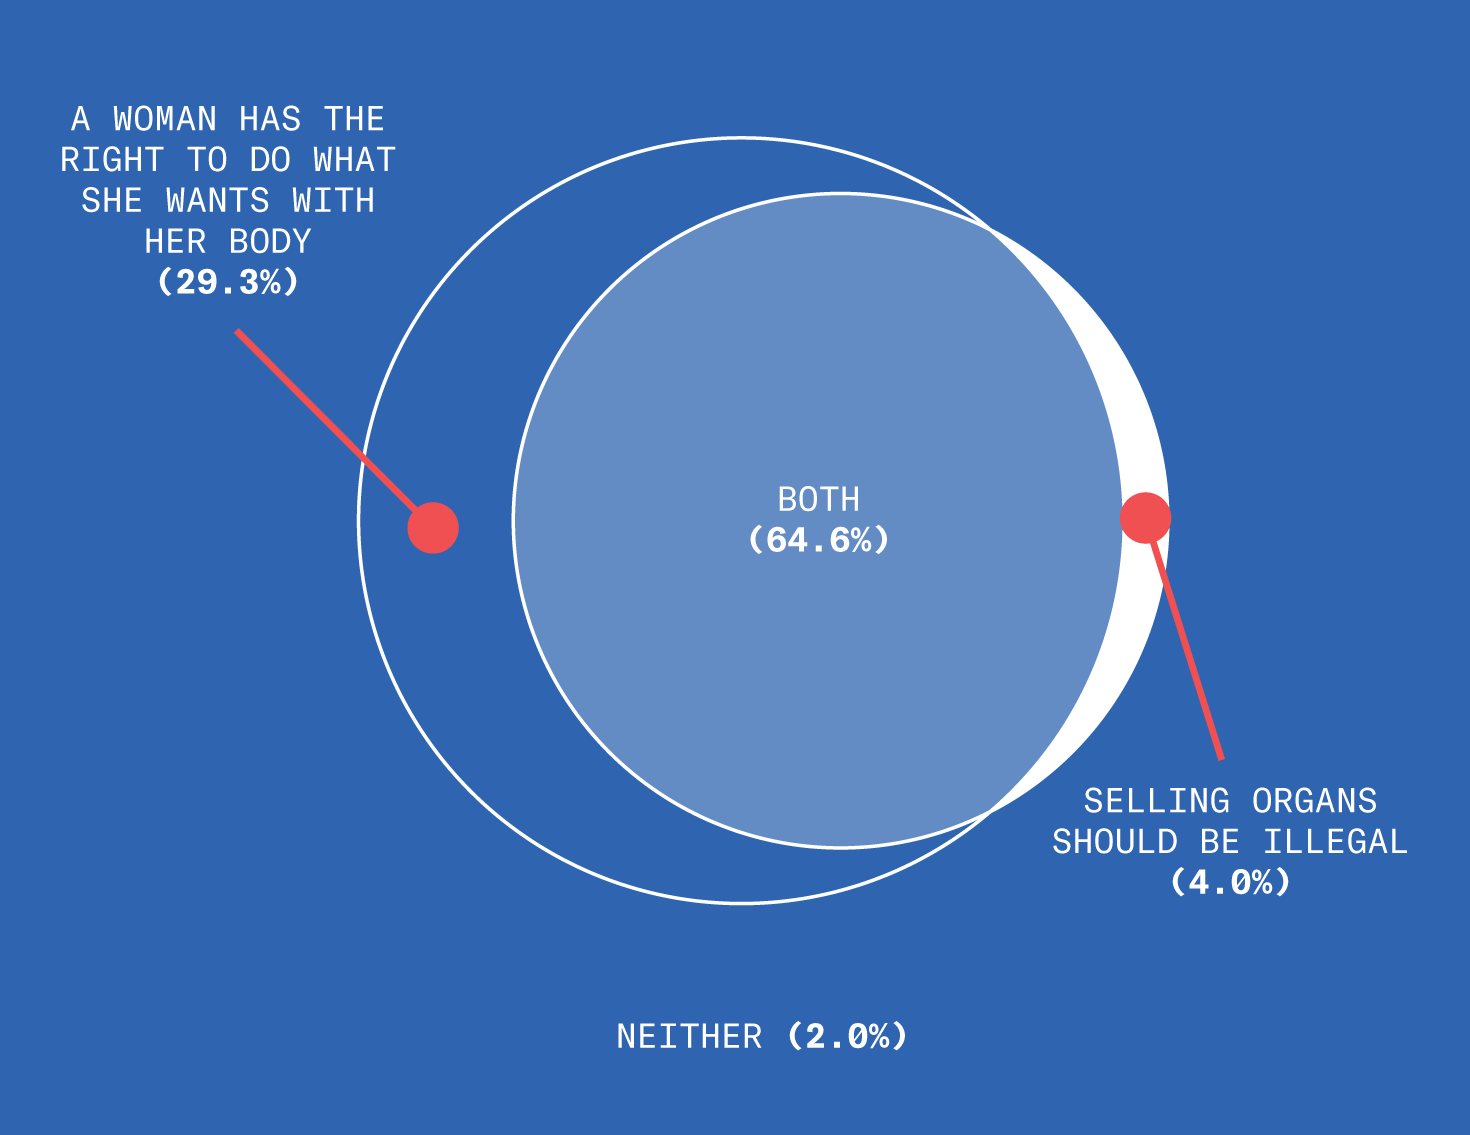
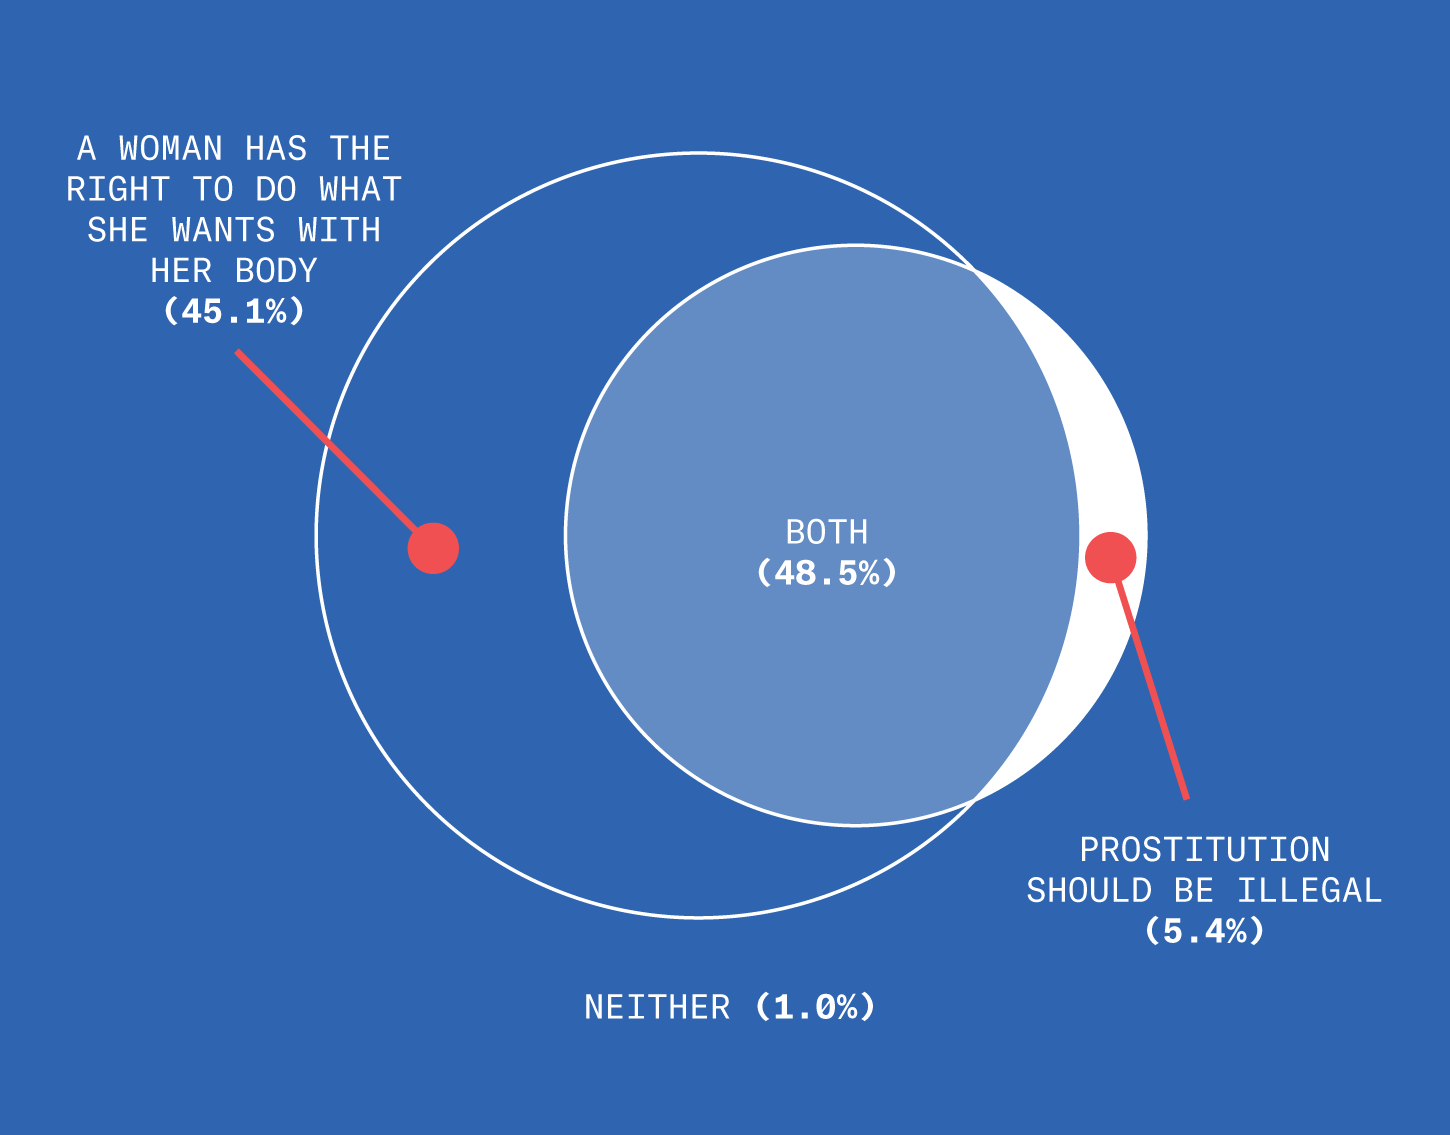
Bodies
Democrats agree that a woman should have the right to do what she wants with her own body.
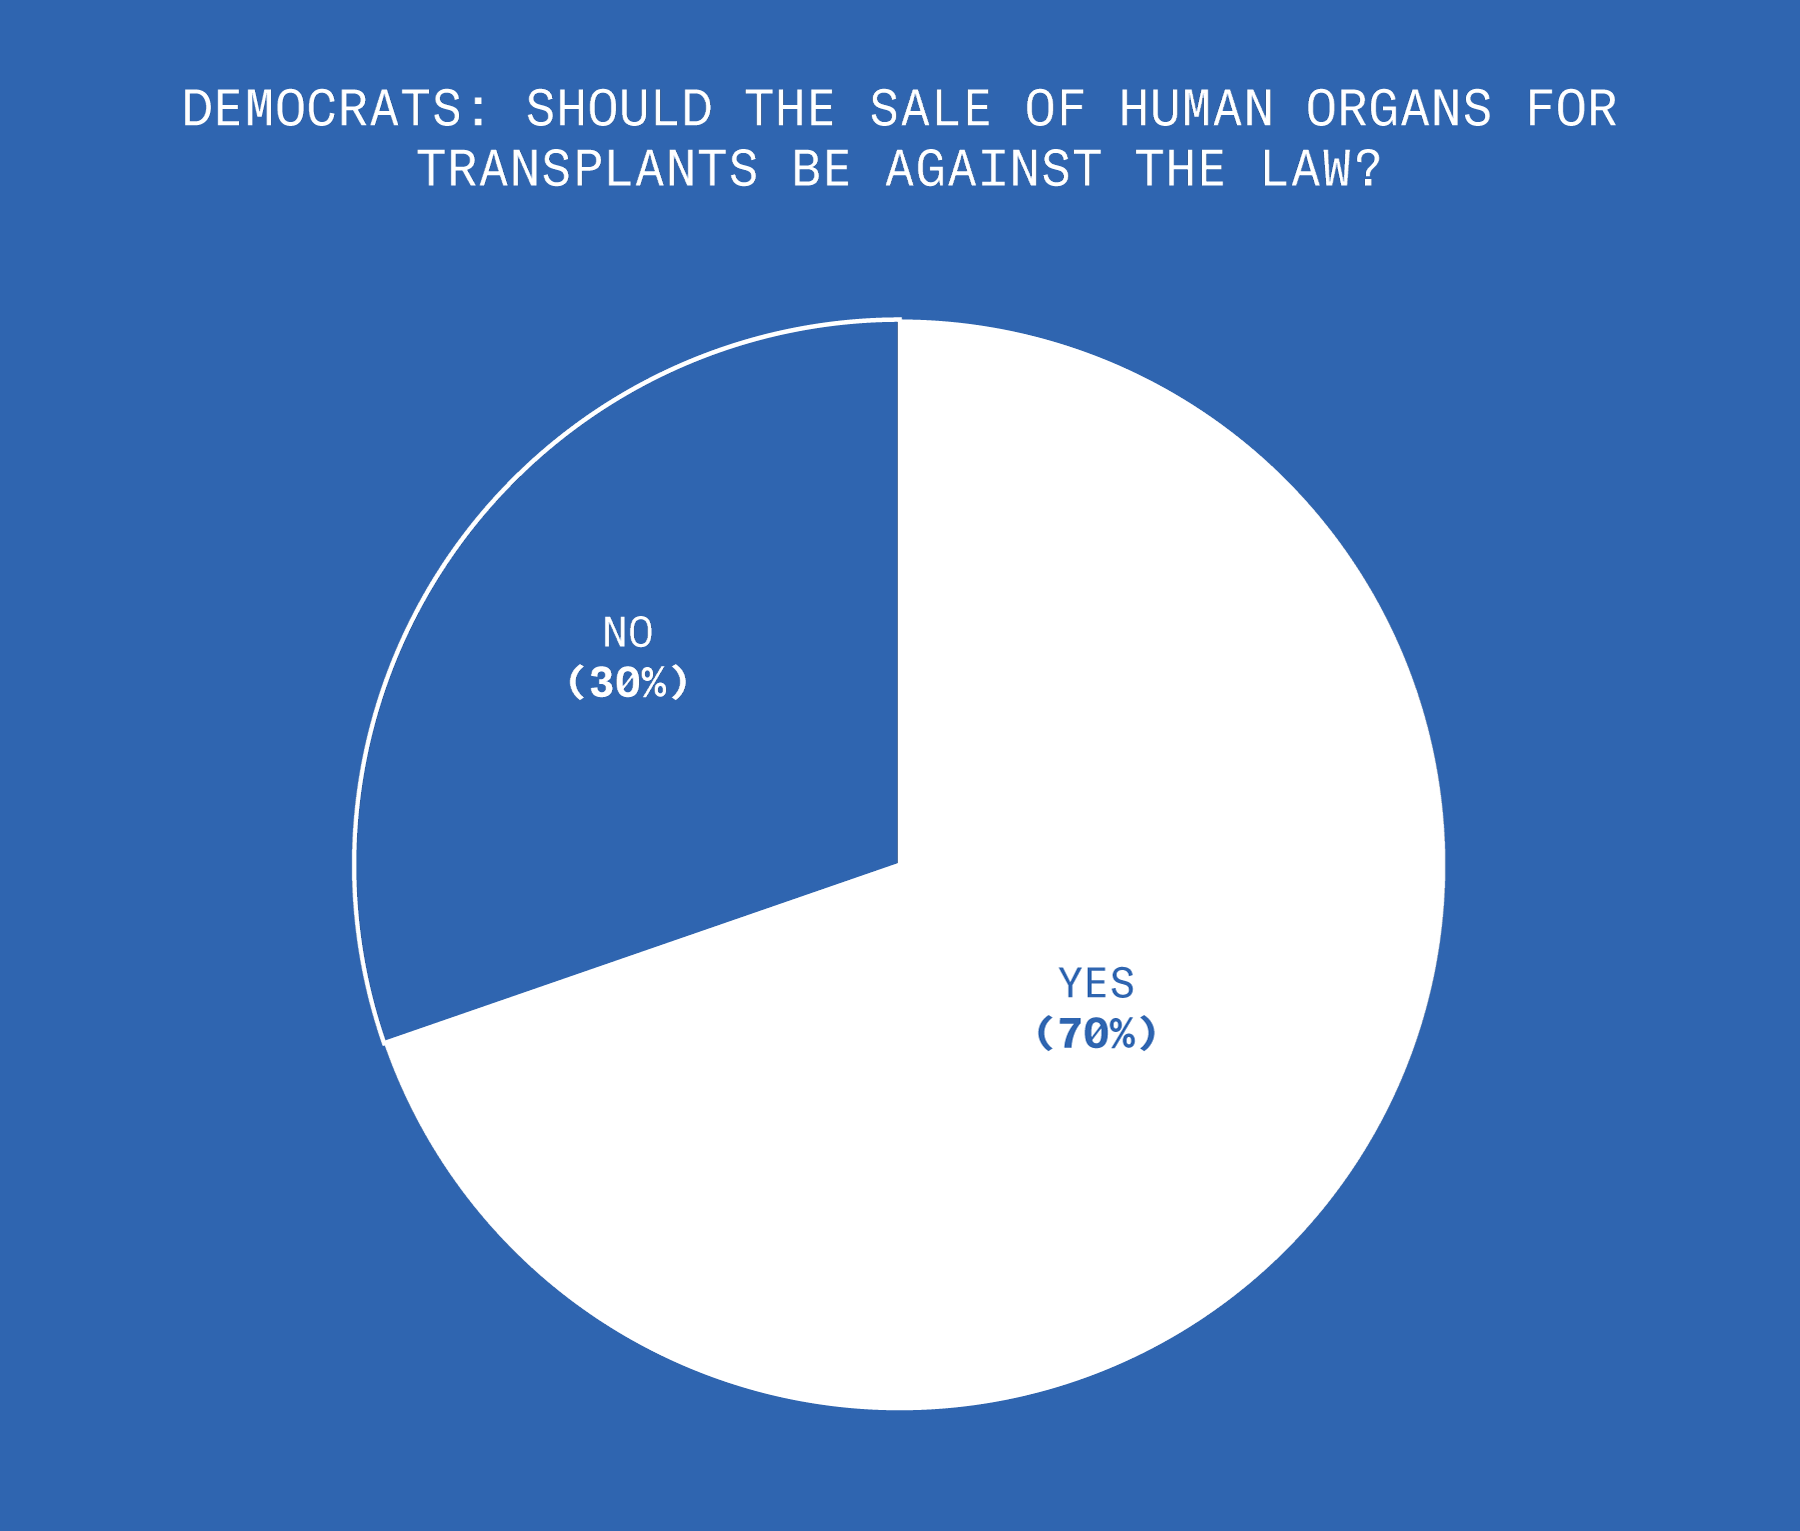
Bodies – 2 of 4
Unless she wants to sell her kidney.
Bodies – 3 of 4
Or have sex for money.
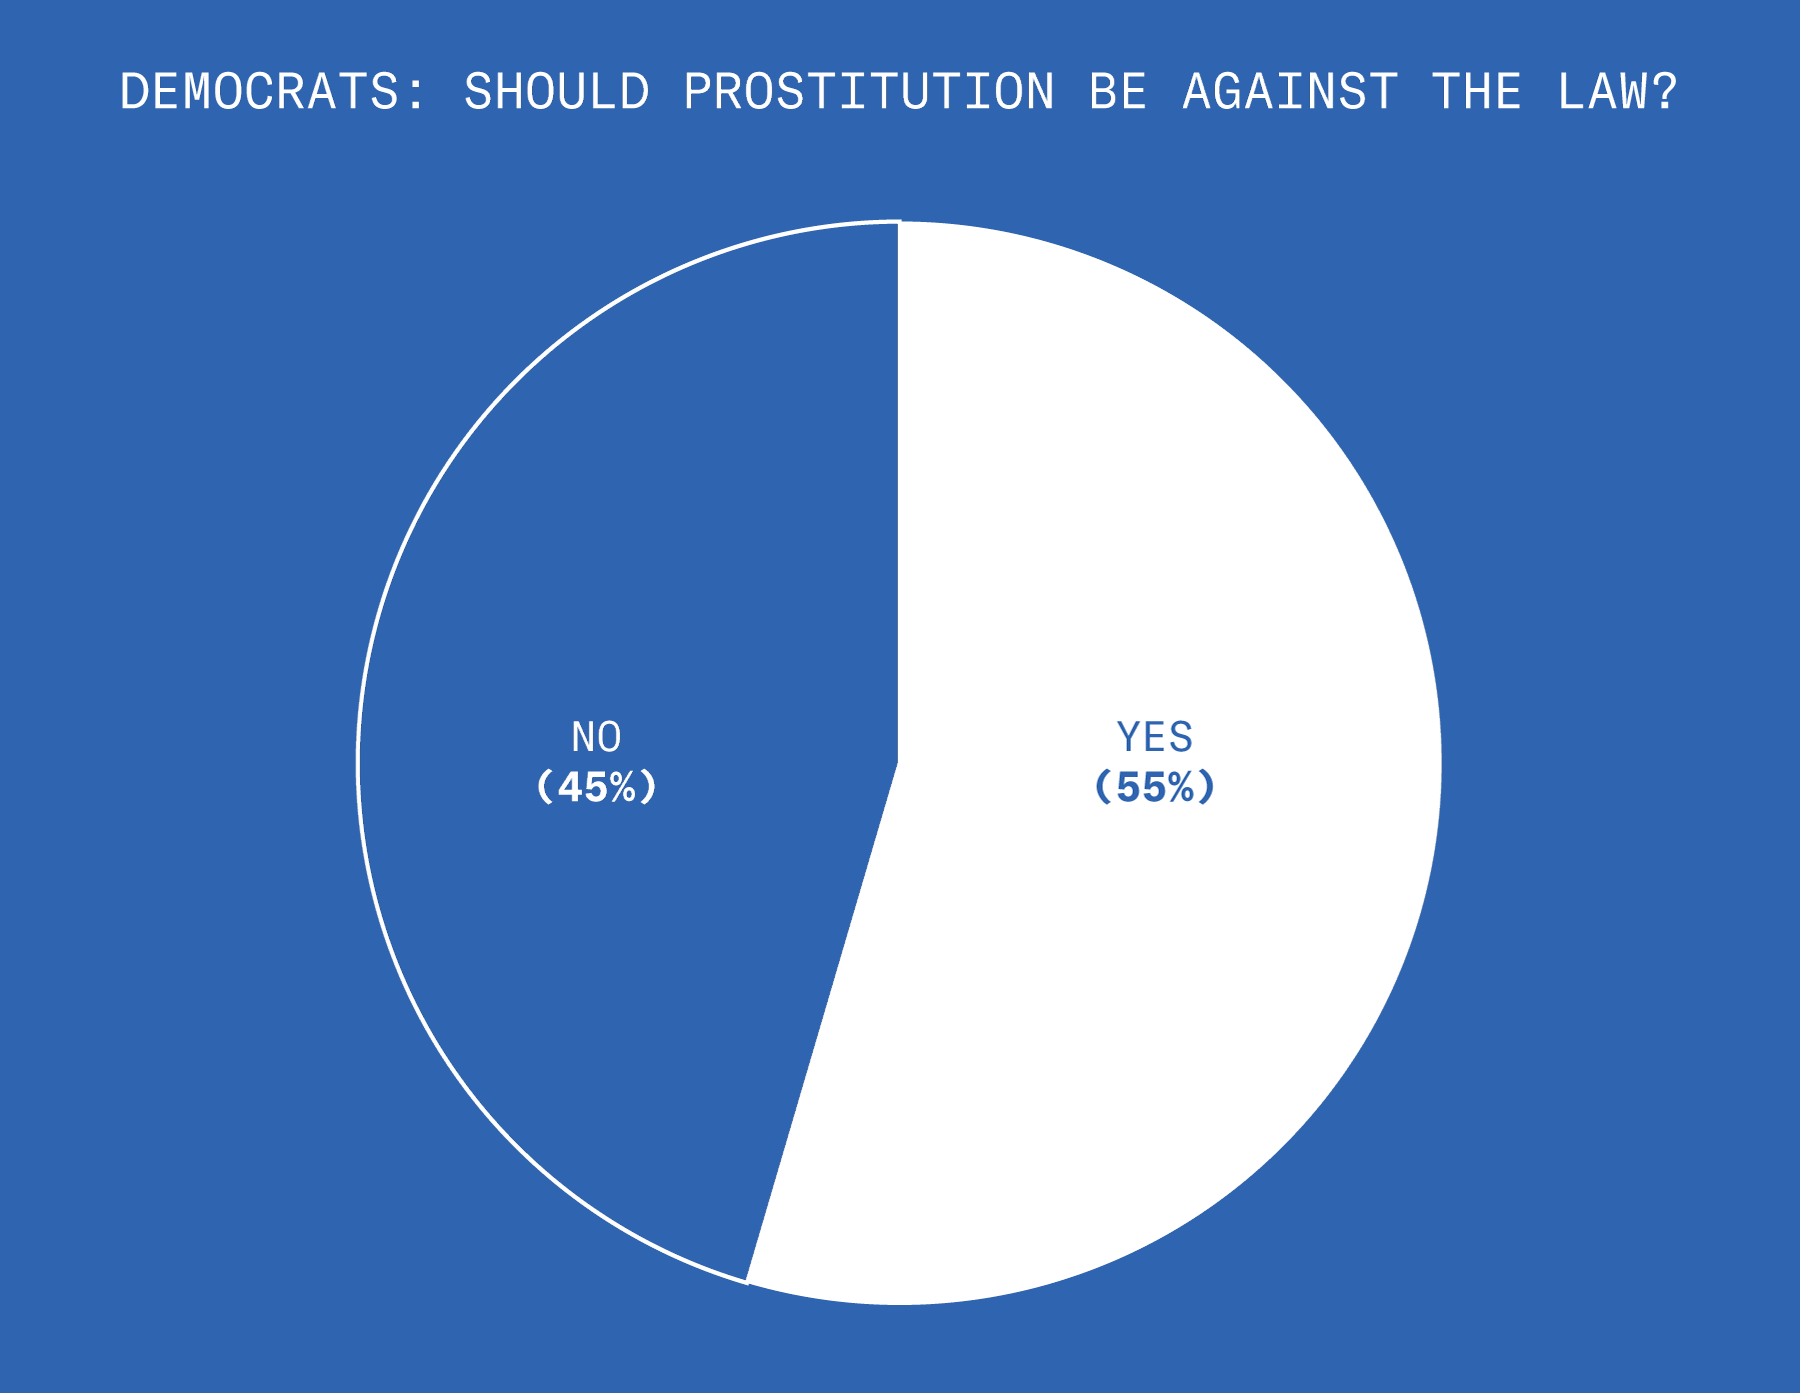
Bodies – 4 of 4
Those are the same Democrats.
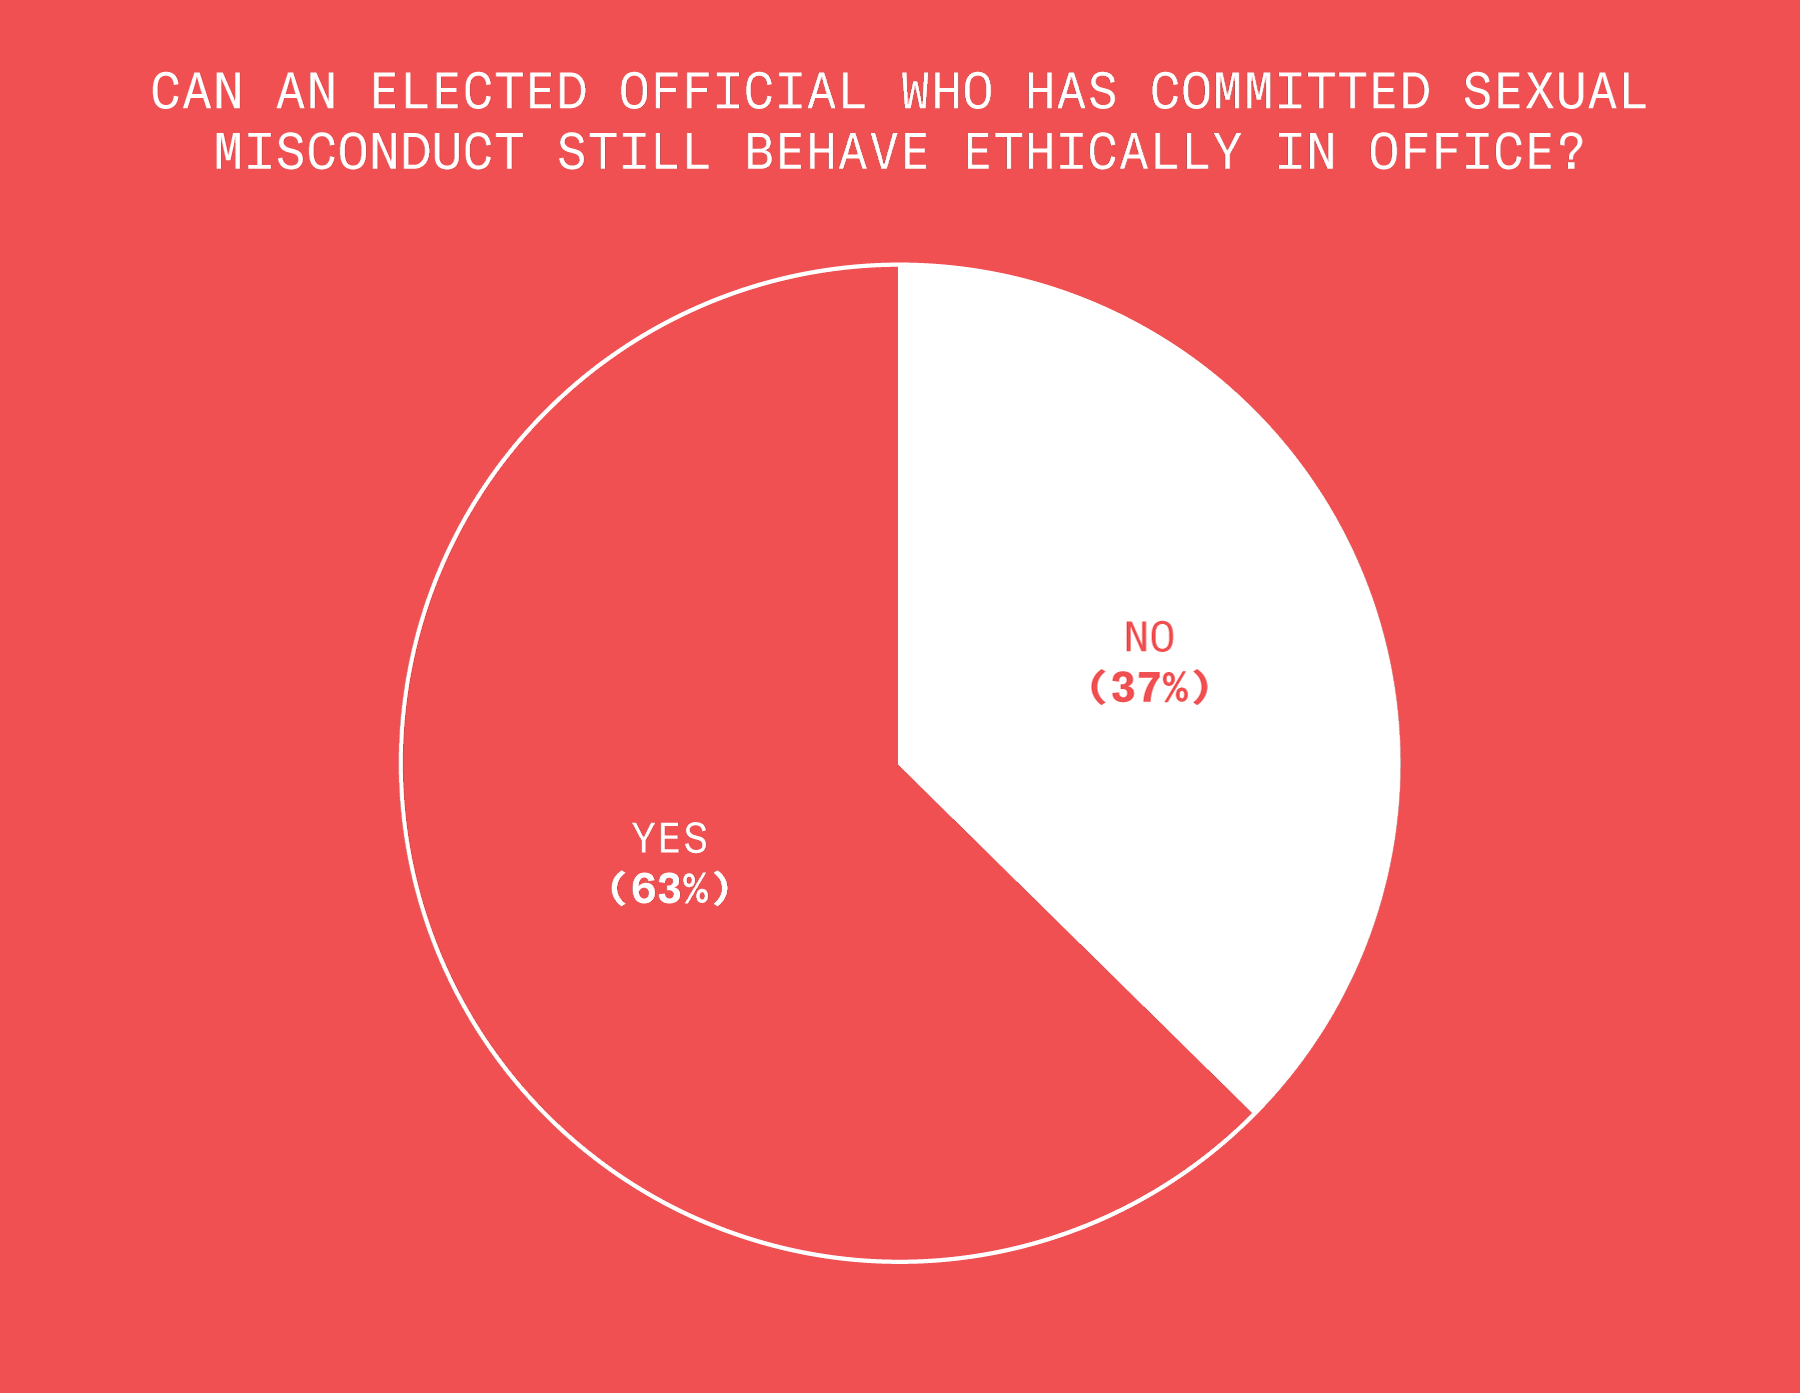
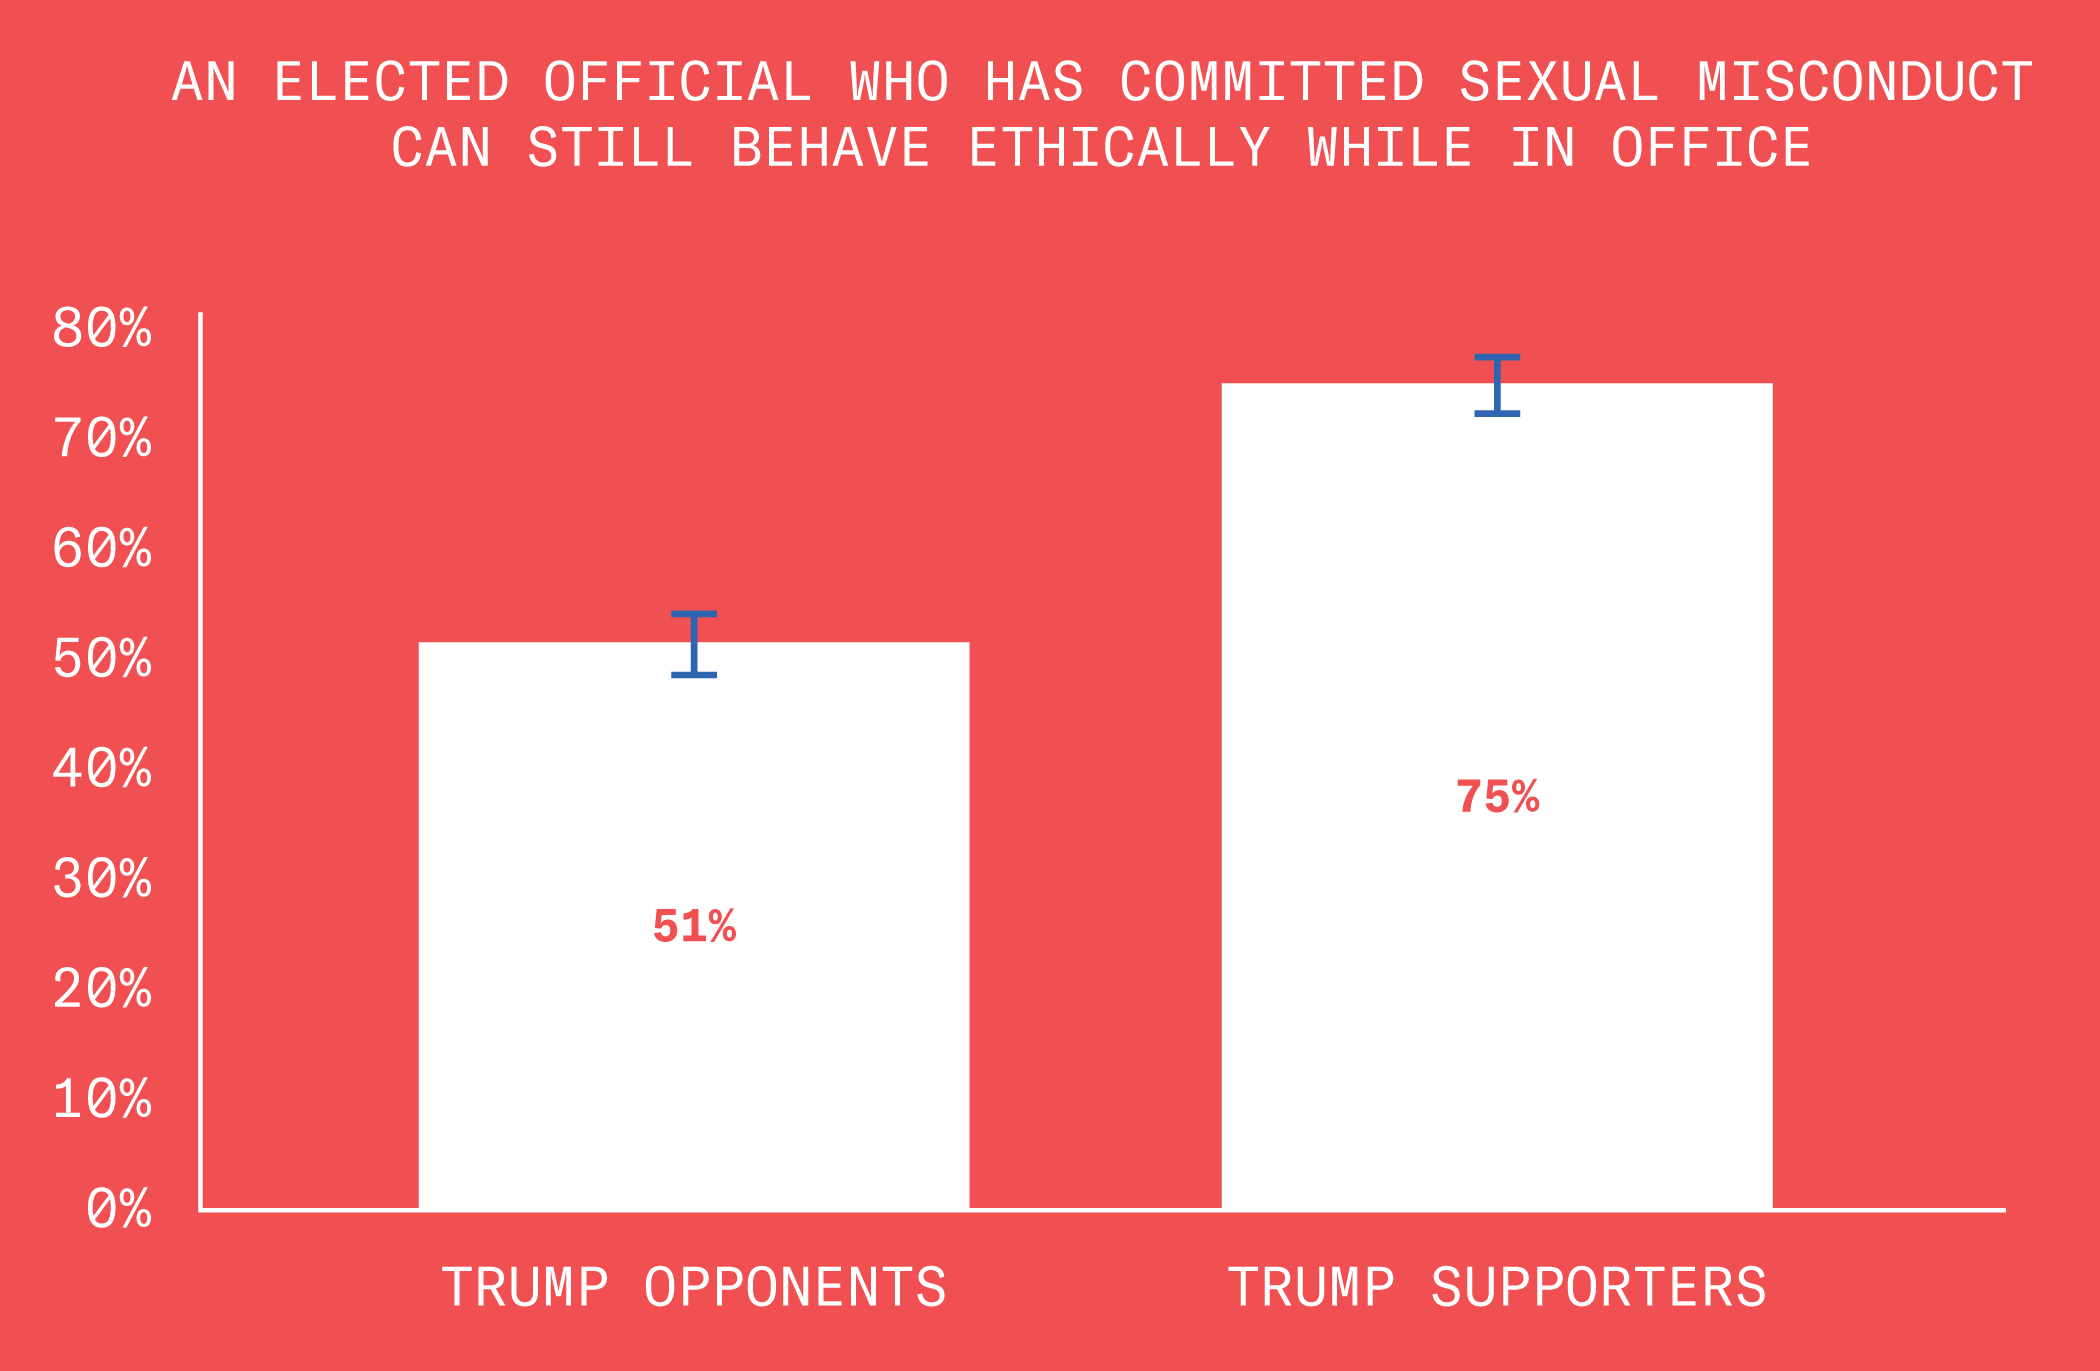
Sexual Misconduct
Can a politician who has committed sexual misconduct in their personal life still behave ethically and fulfill their duties while in office? A majority say yes.
Sexual Misconduct – 2 of 3
White people are mostly okay with sexual misconduct. I wonder what that’s all about?

Sexual Misconduct – 3 of 3
Oh, right.
Words, words, words – 2 of 3
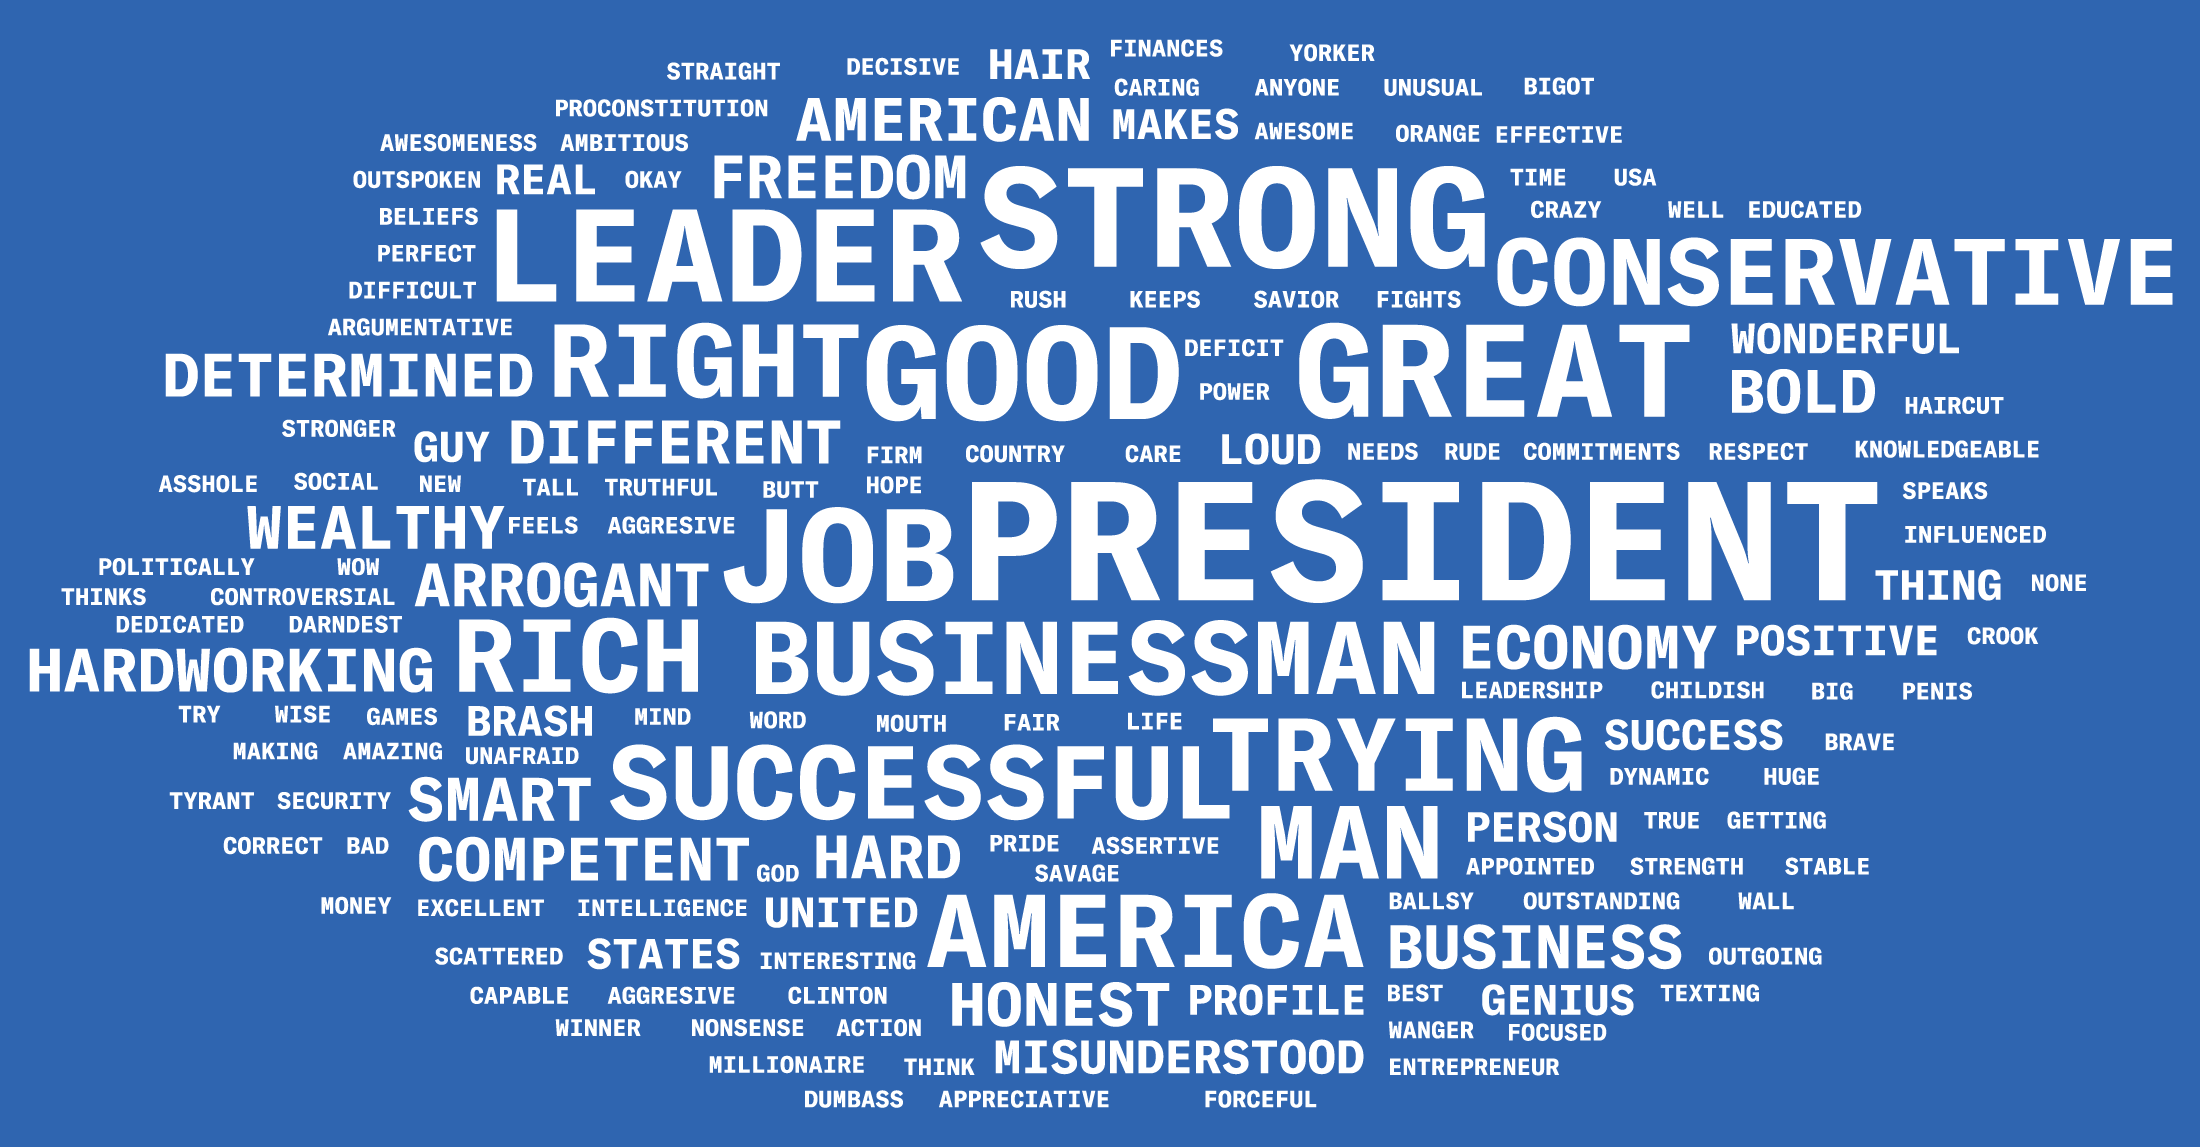
Here’s a word cloud based on the responses of Trump supporters:
Words, words, words – 3 of 3
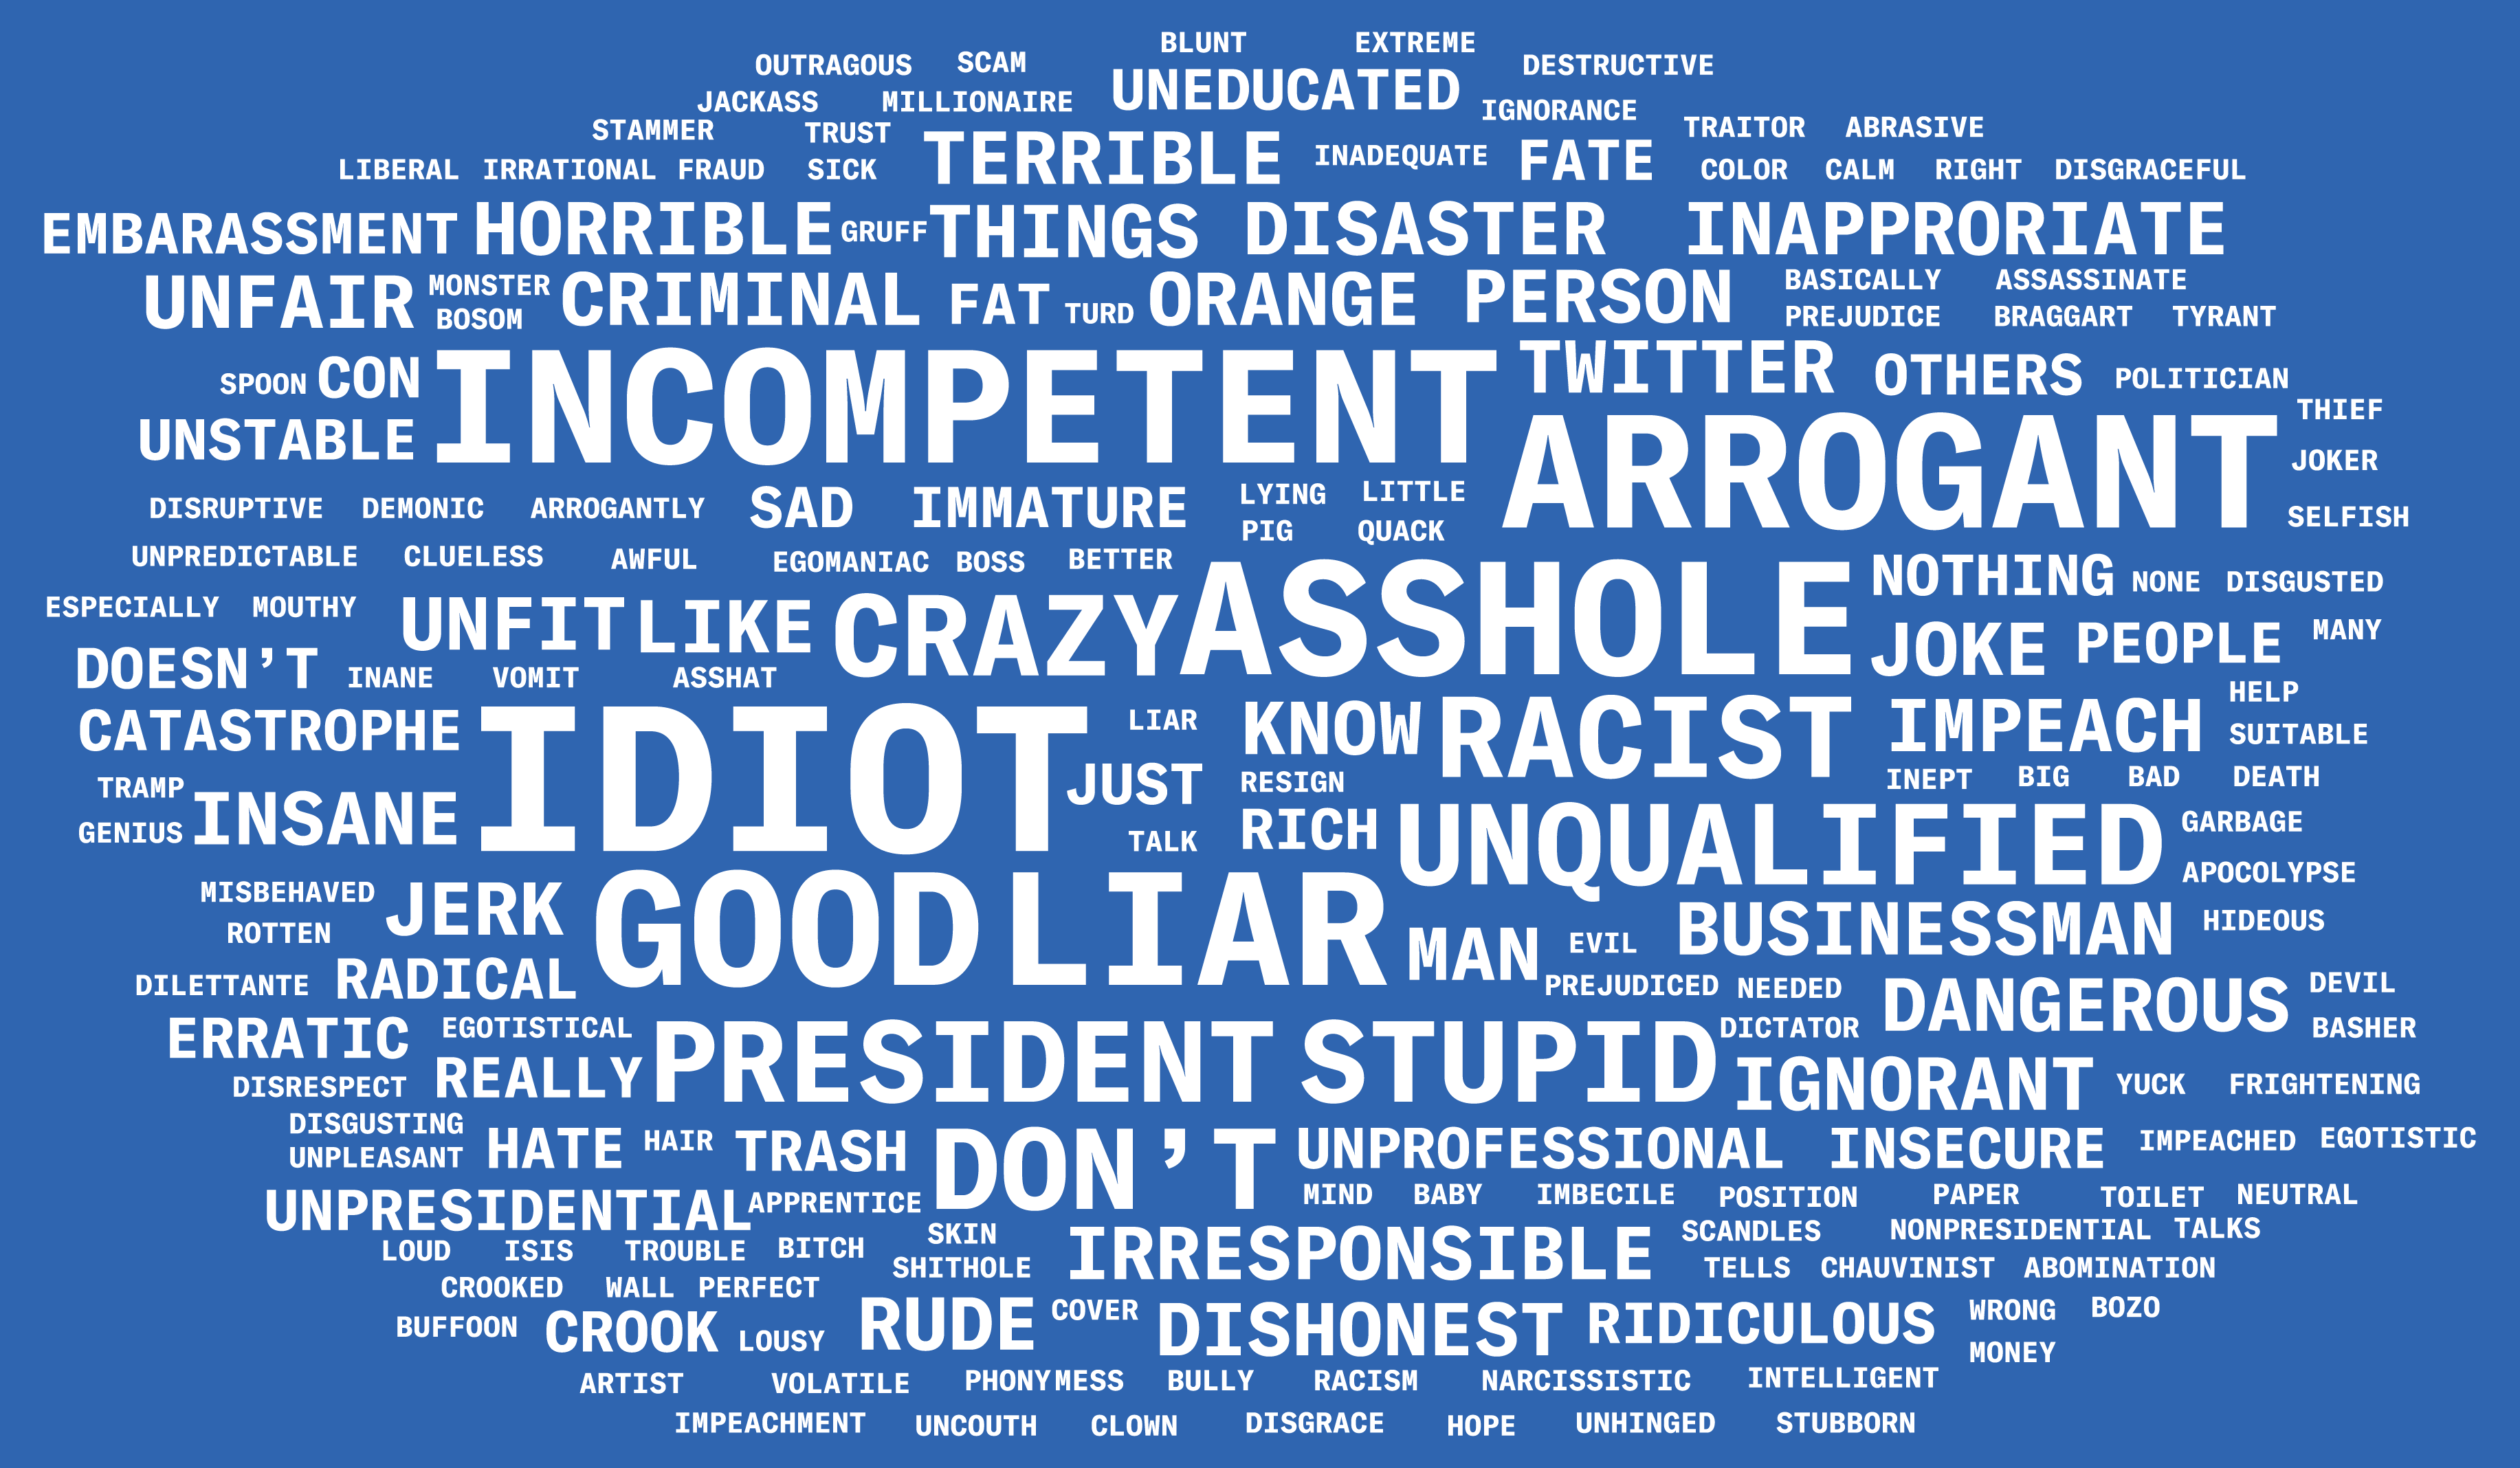
And here’s a word cloud based on the responses of Trump opponents:
Border Wall
A majority of Americans think they could probably get past Trump’s border wall.

Border Wall – 2 of 3
And yet, a good chunk of those people want to build the wall anyways.
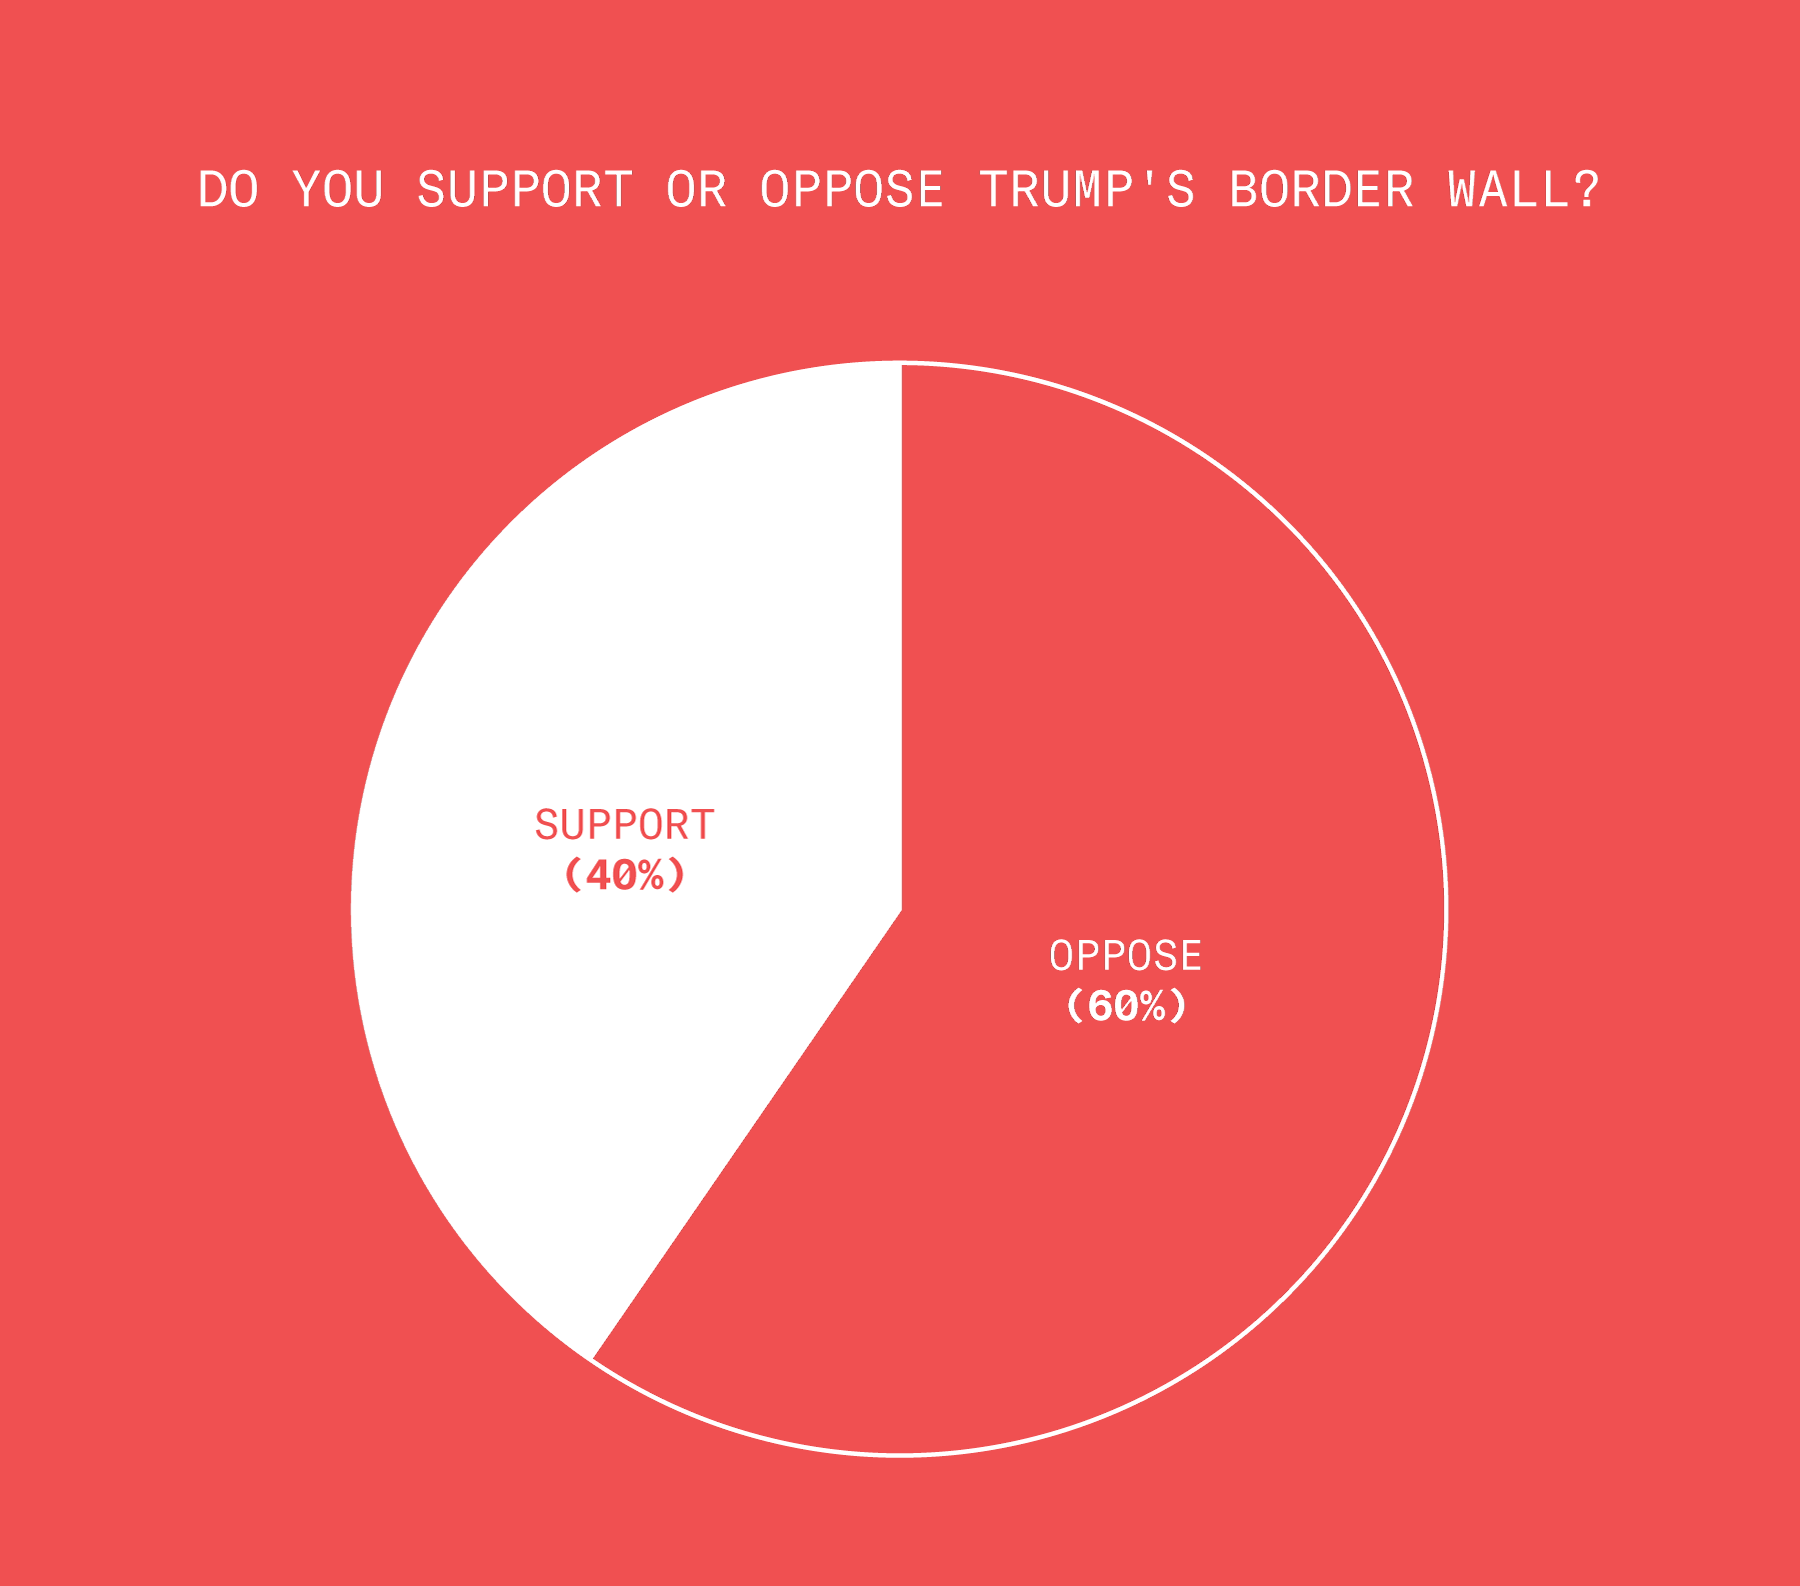
Border Wall – 3 of 3
More than half of the people who support Trump’s border wall believe that they could get past it.

Maybe democracy isn't such a good idea.
Two Trumps
Has unemployment gone up, gone down, or stayed the same since Donald Trump became president? Trump supporters are more likely to get this question right (it has gone down approximately 0.7%).
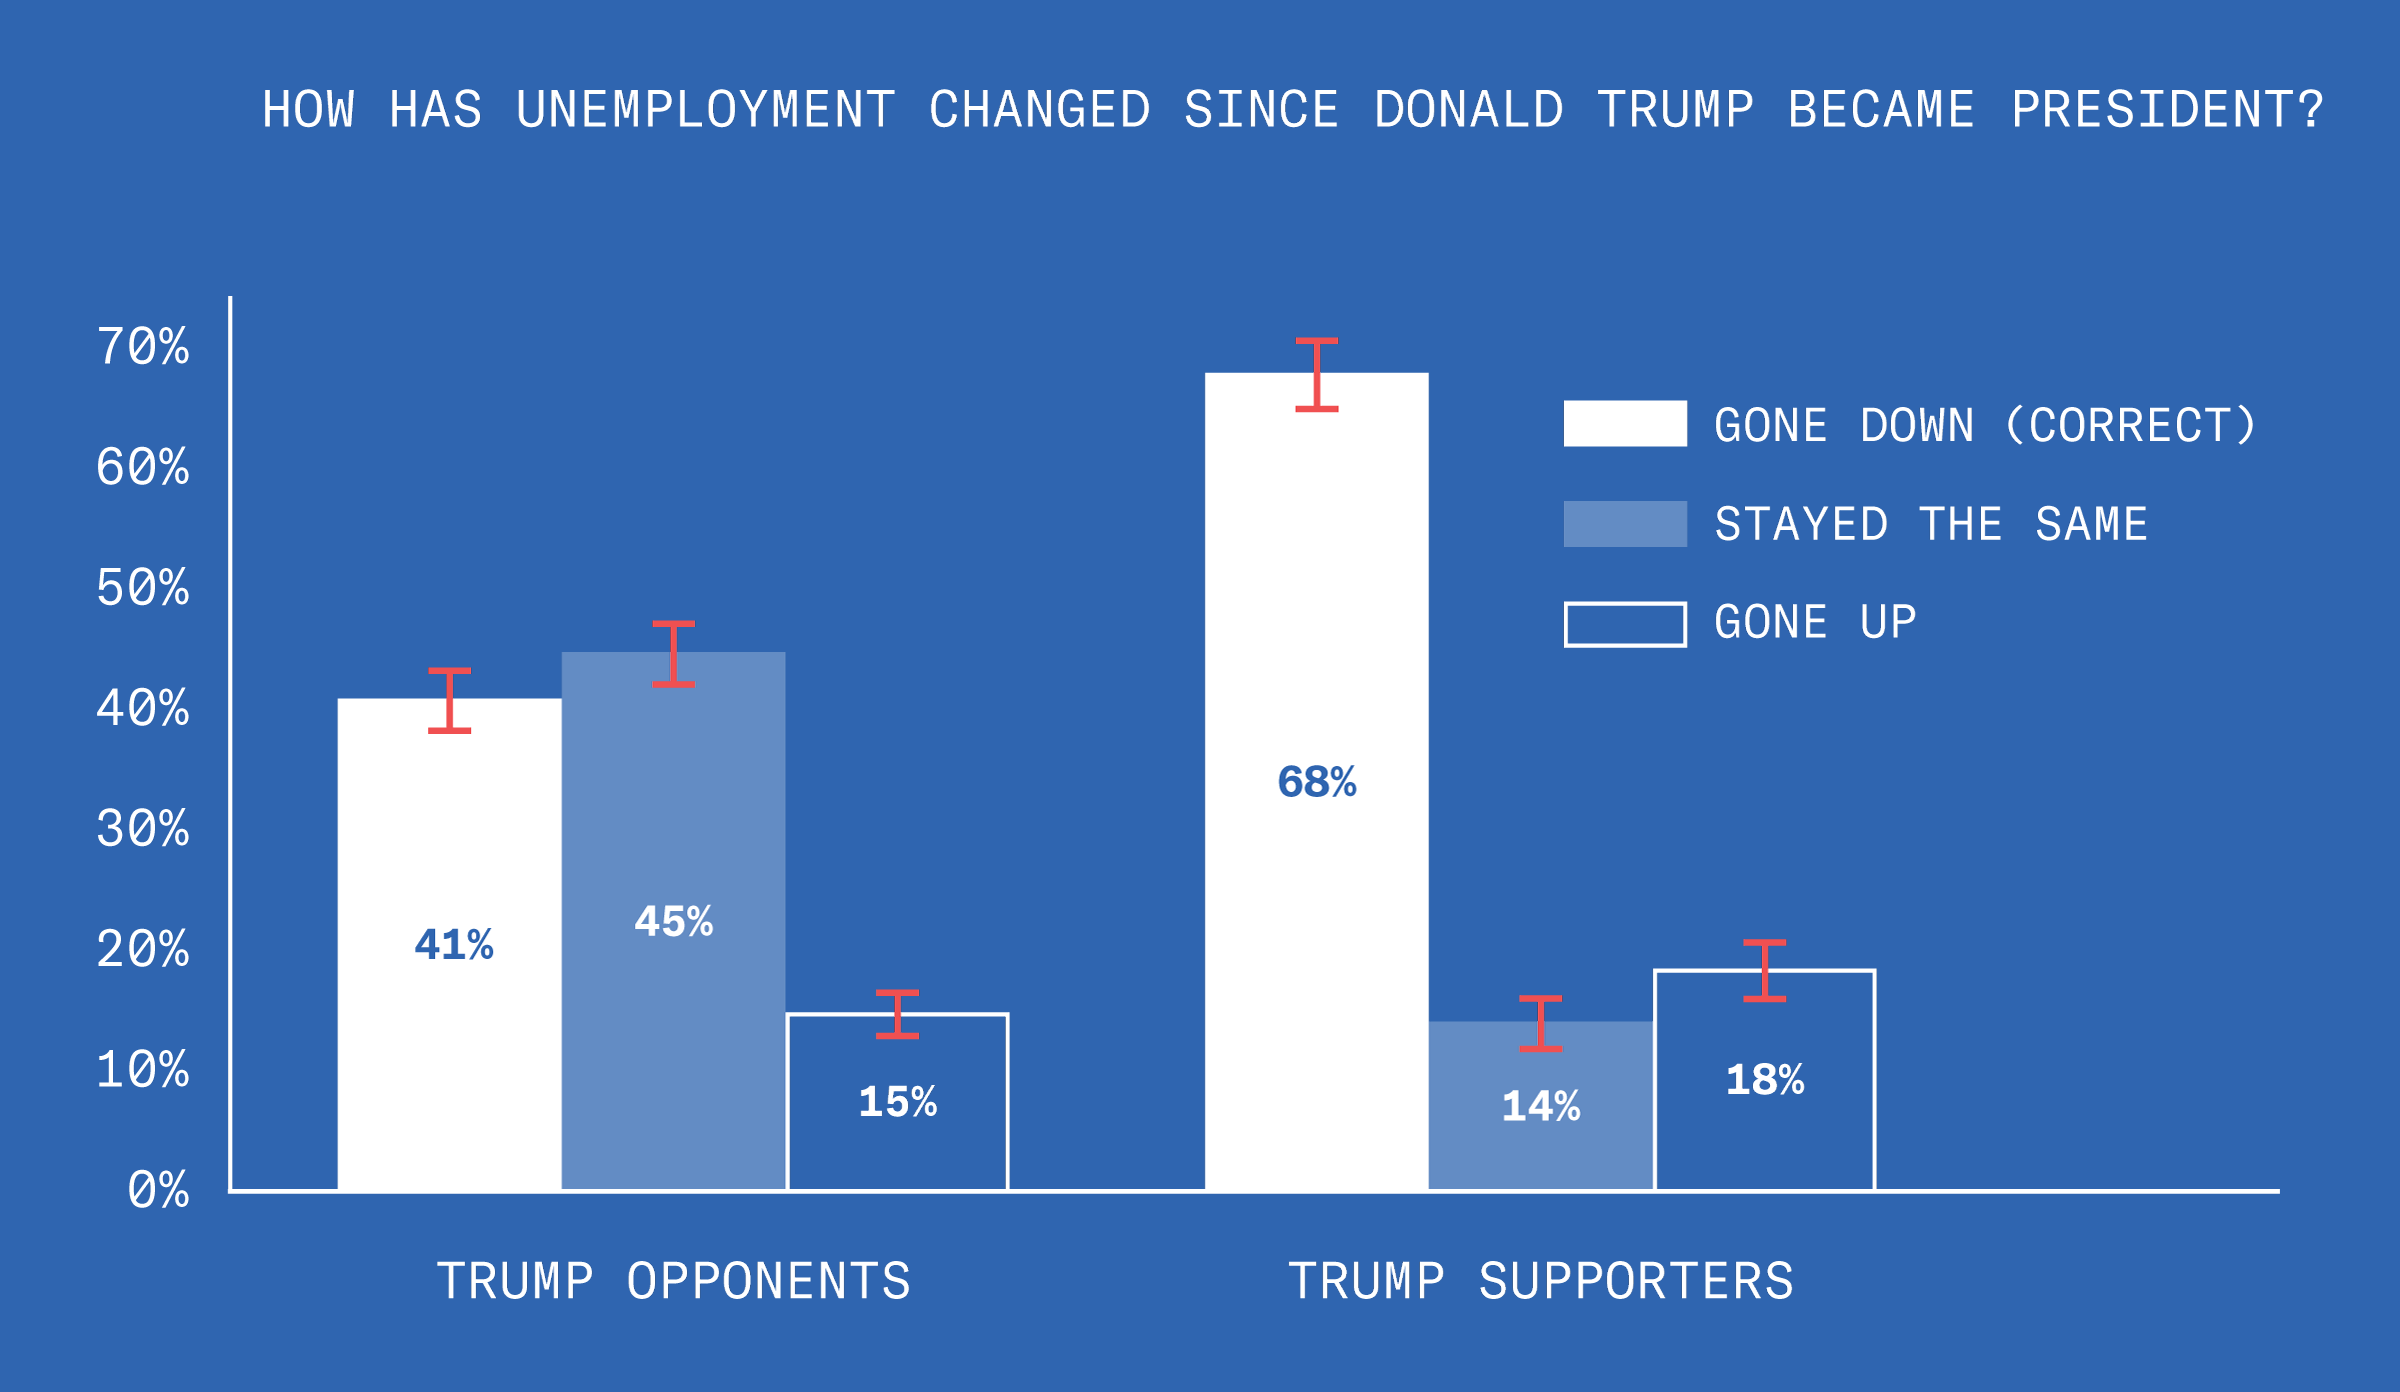
Two Trumps – 2 of 4
Has Donald Trump always publicly opposed abortion? Trump supporters are more likely to get this question wrong (the answer is no).

Two Trumps – 3 of 4
We asked Americans to guess Trump’s weight. The guesses were surprisingly close to the weight that was reported in Trump’s medical exam: 239 pounds.
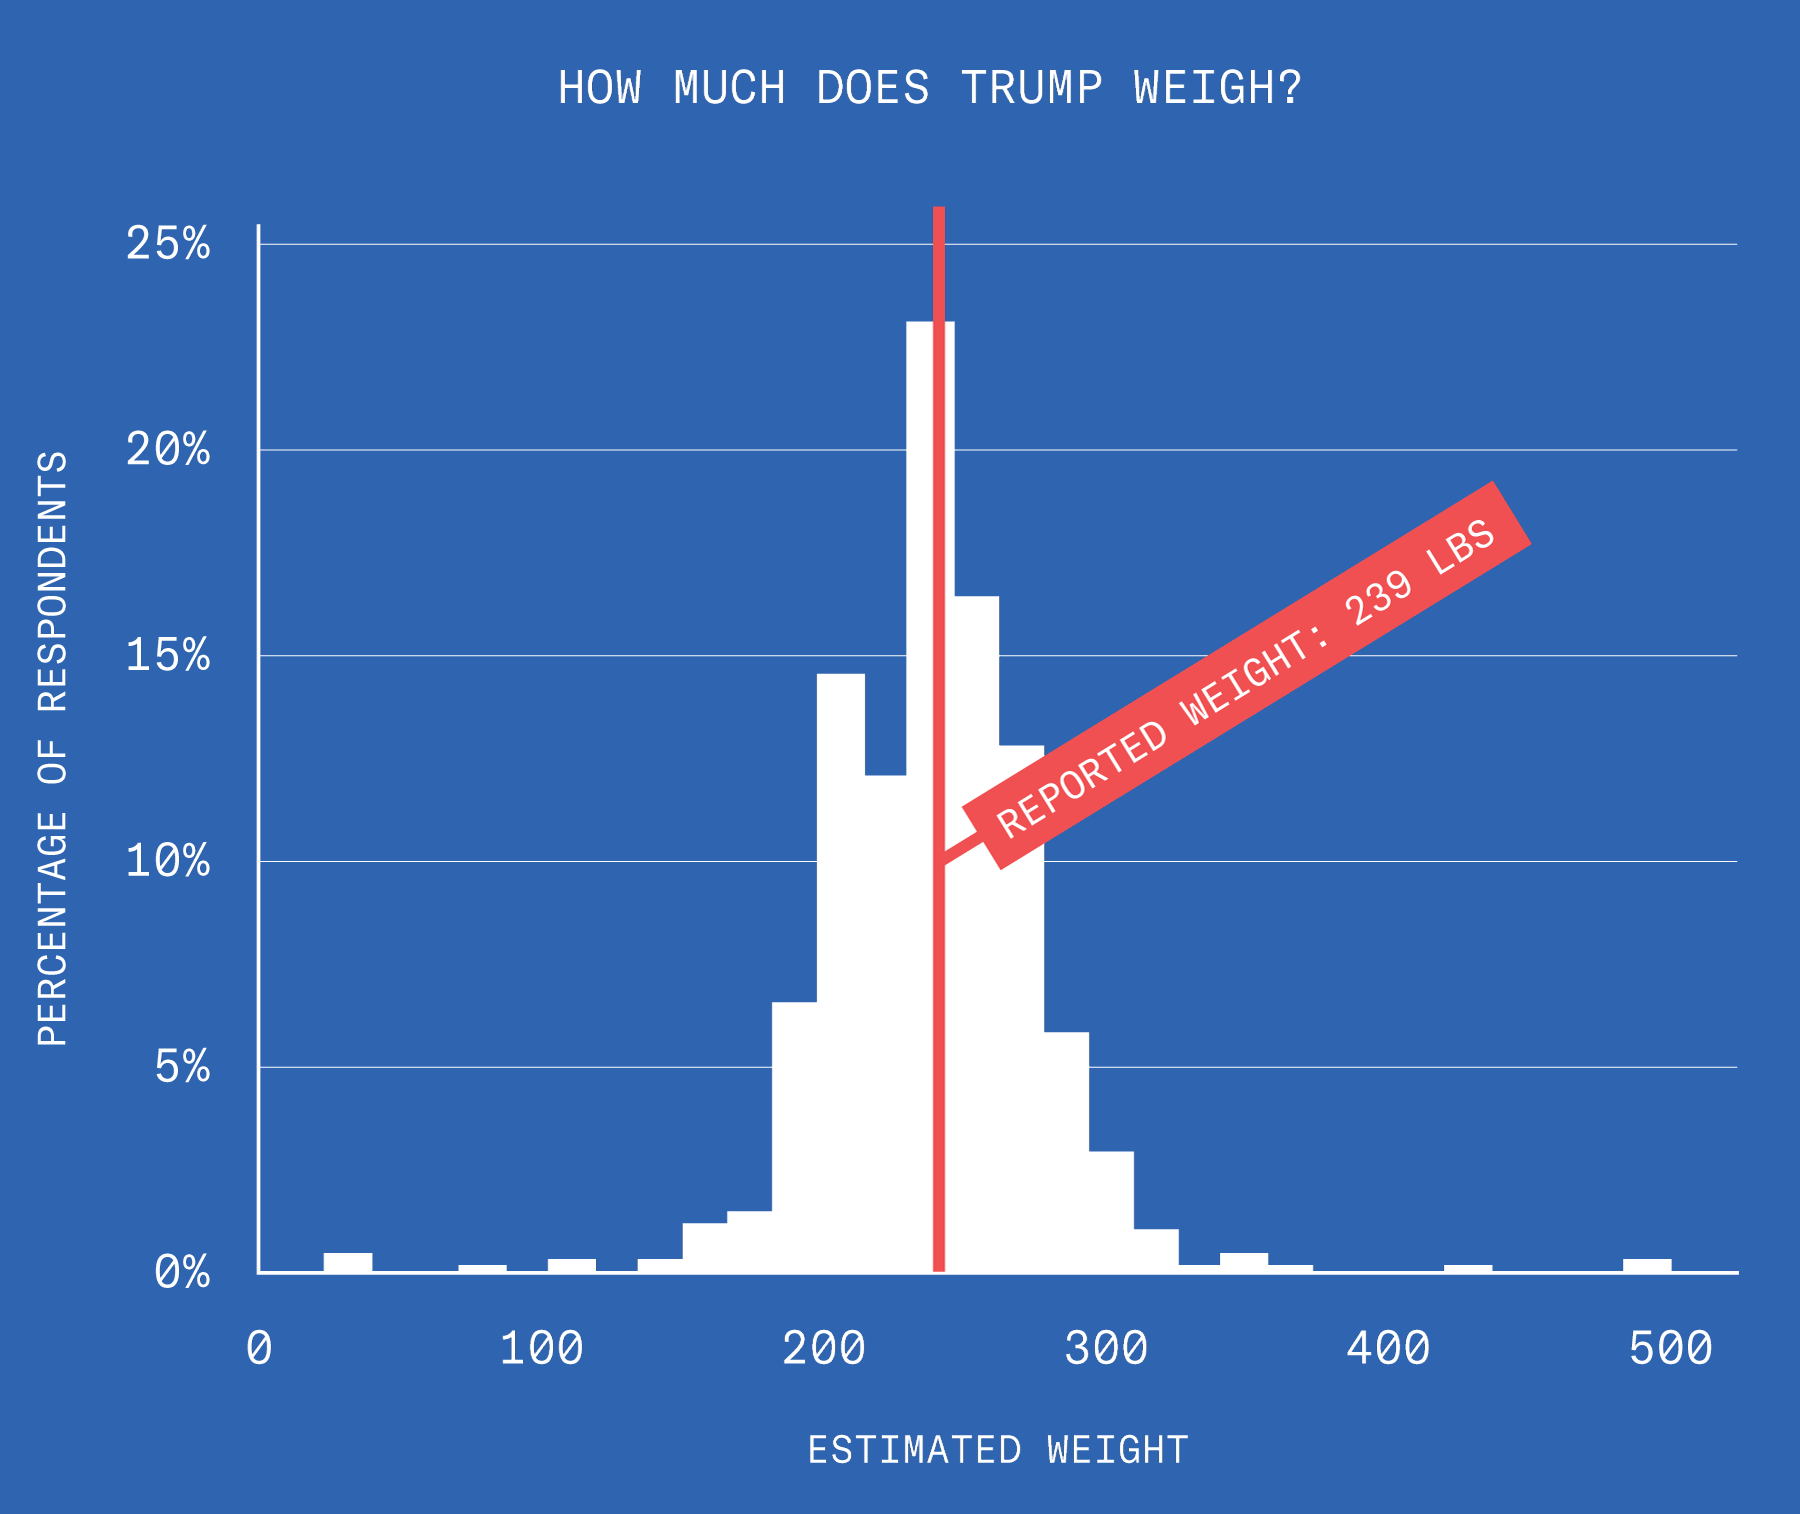
This is like that time that 12,000 people guessed the weight of a cow.
Two Trumps – 4 of 4
But was that medical exam accurate? Most Trump supporters contend that it was fake news.
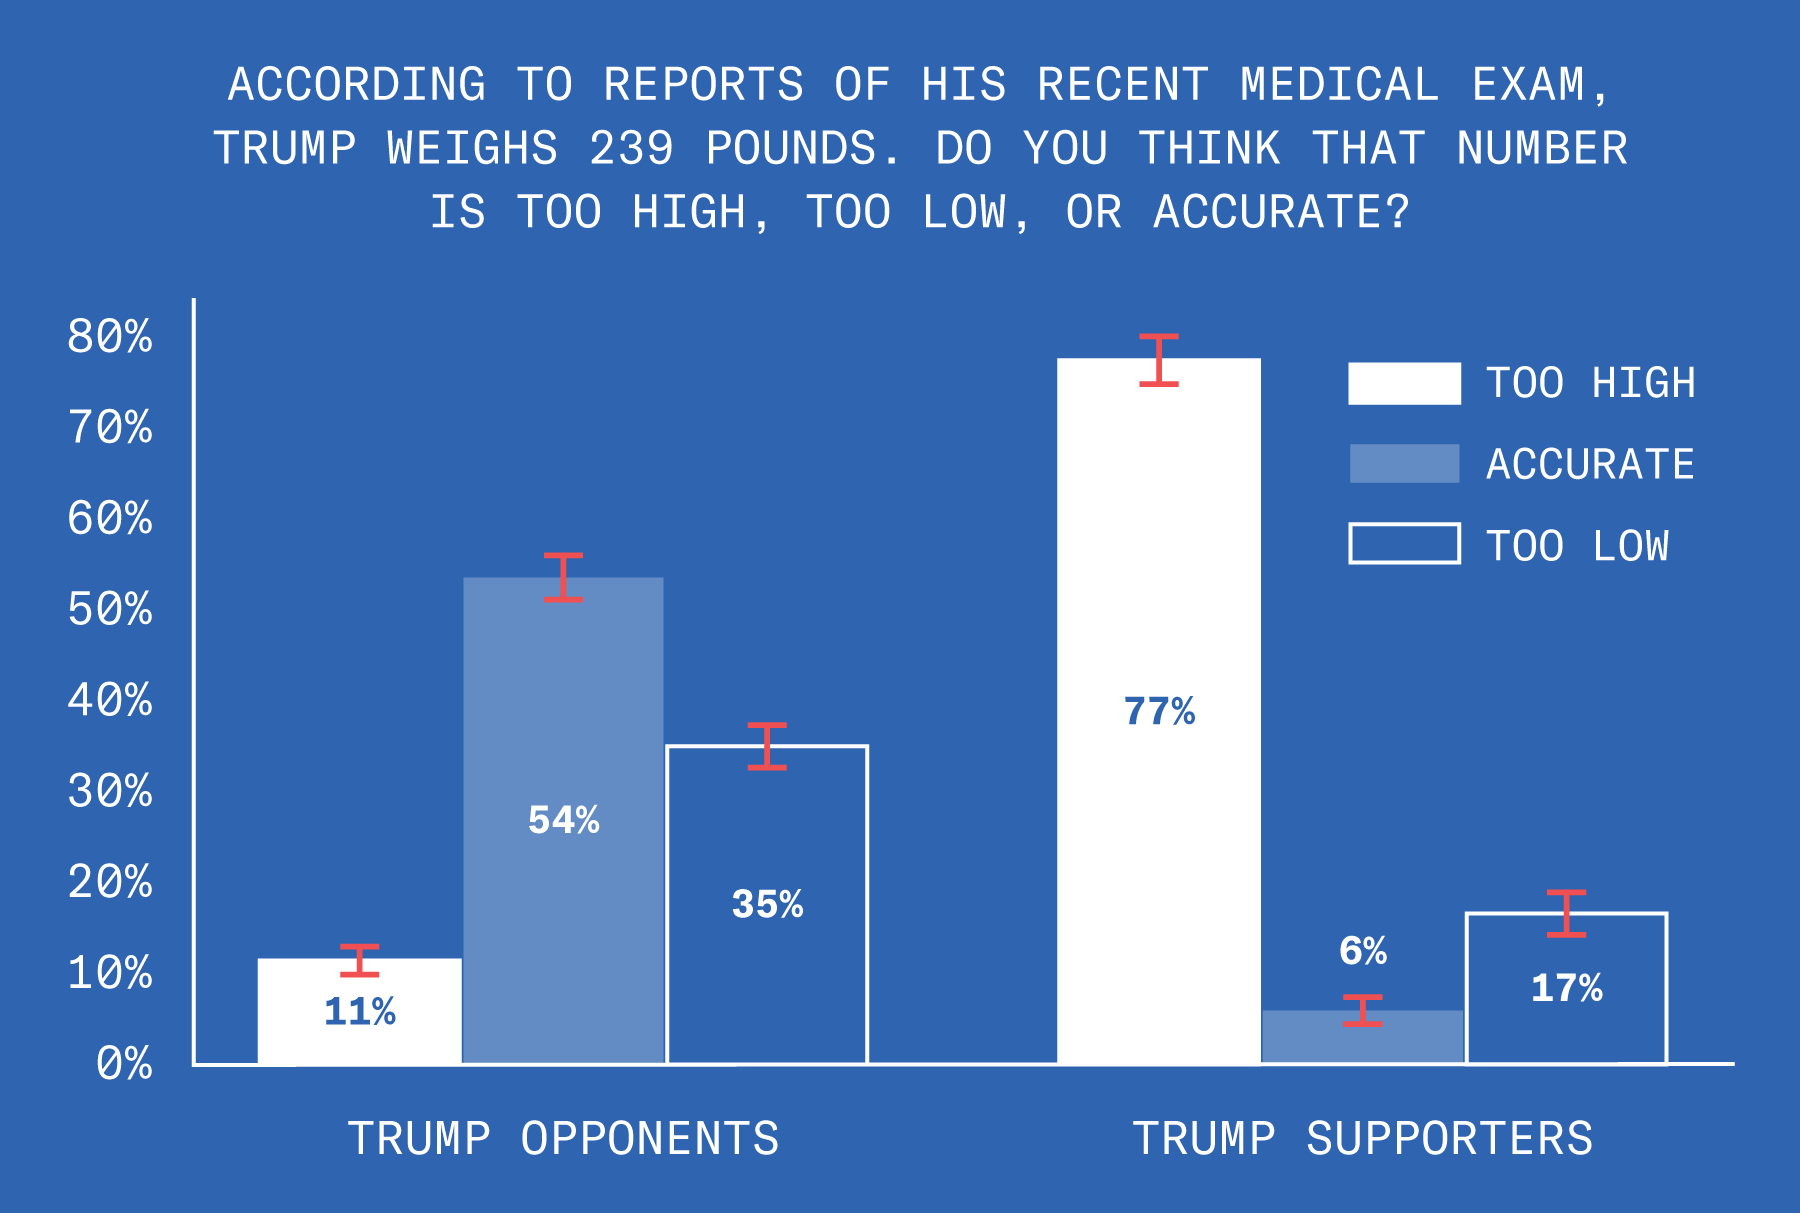
Trump’s supporters would believe he was an Olympic gymnast if that’s what he told them.
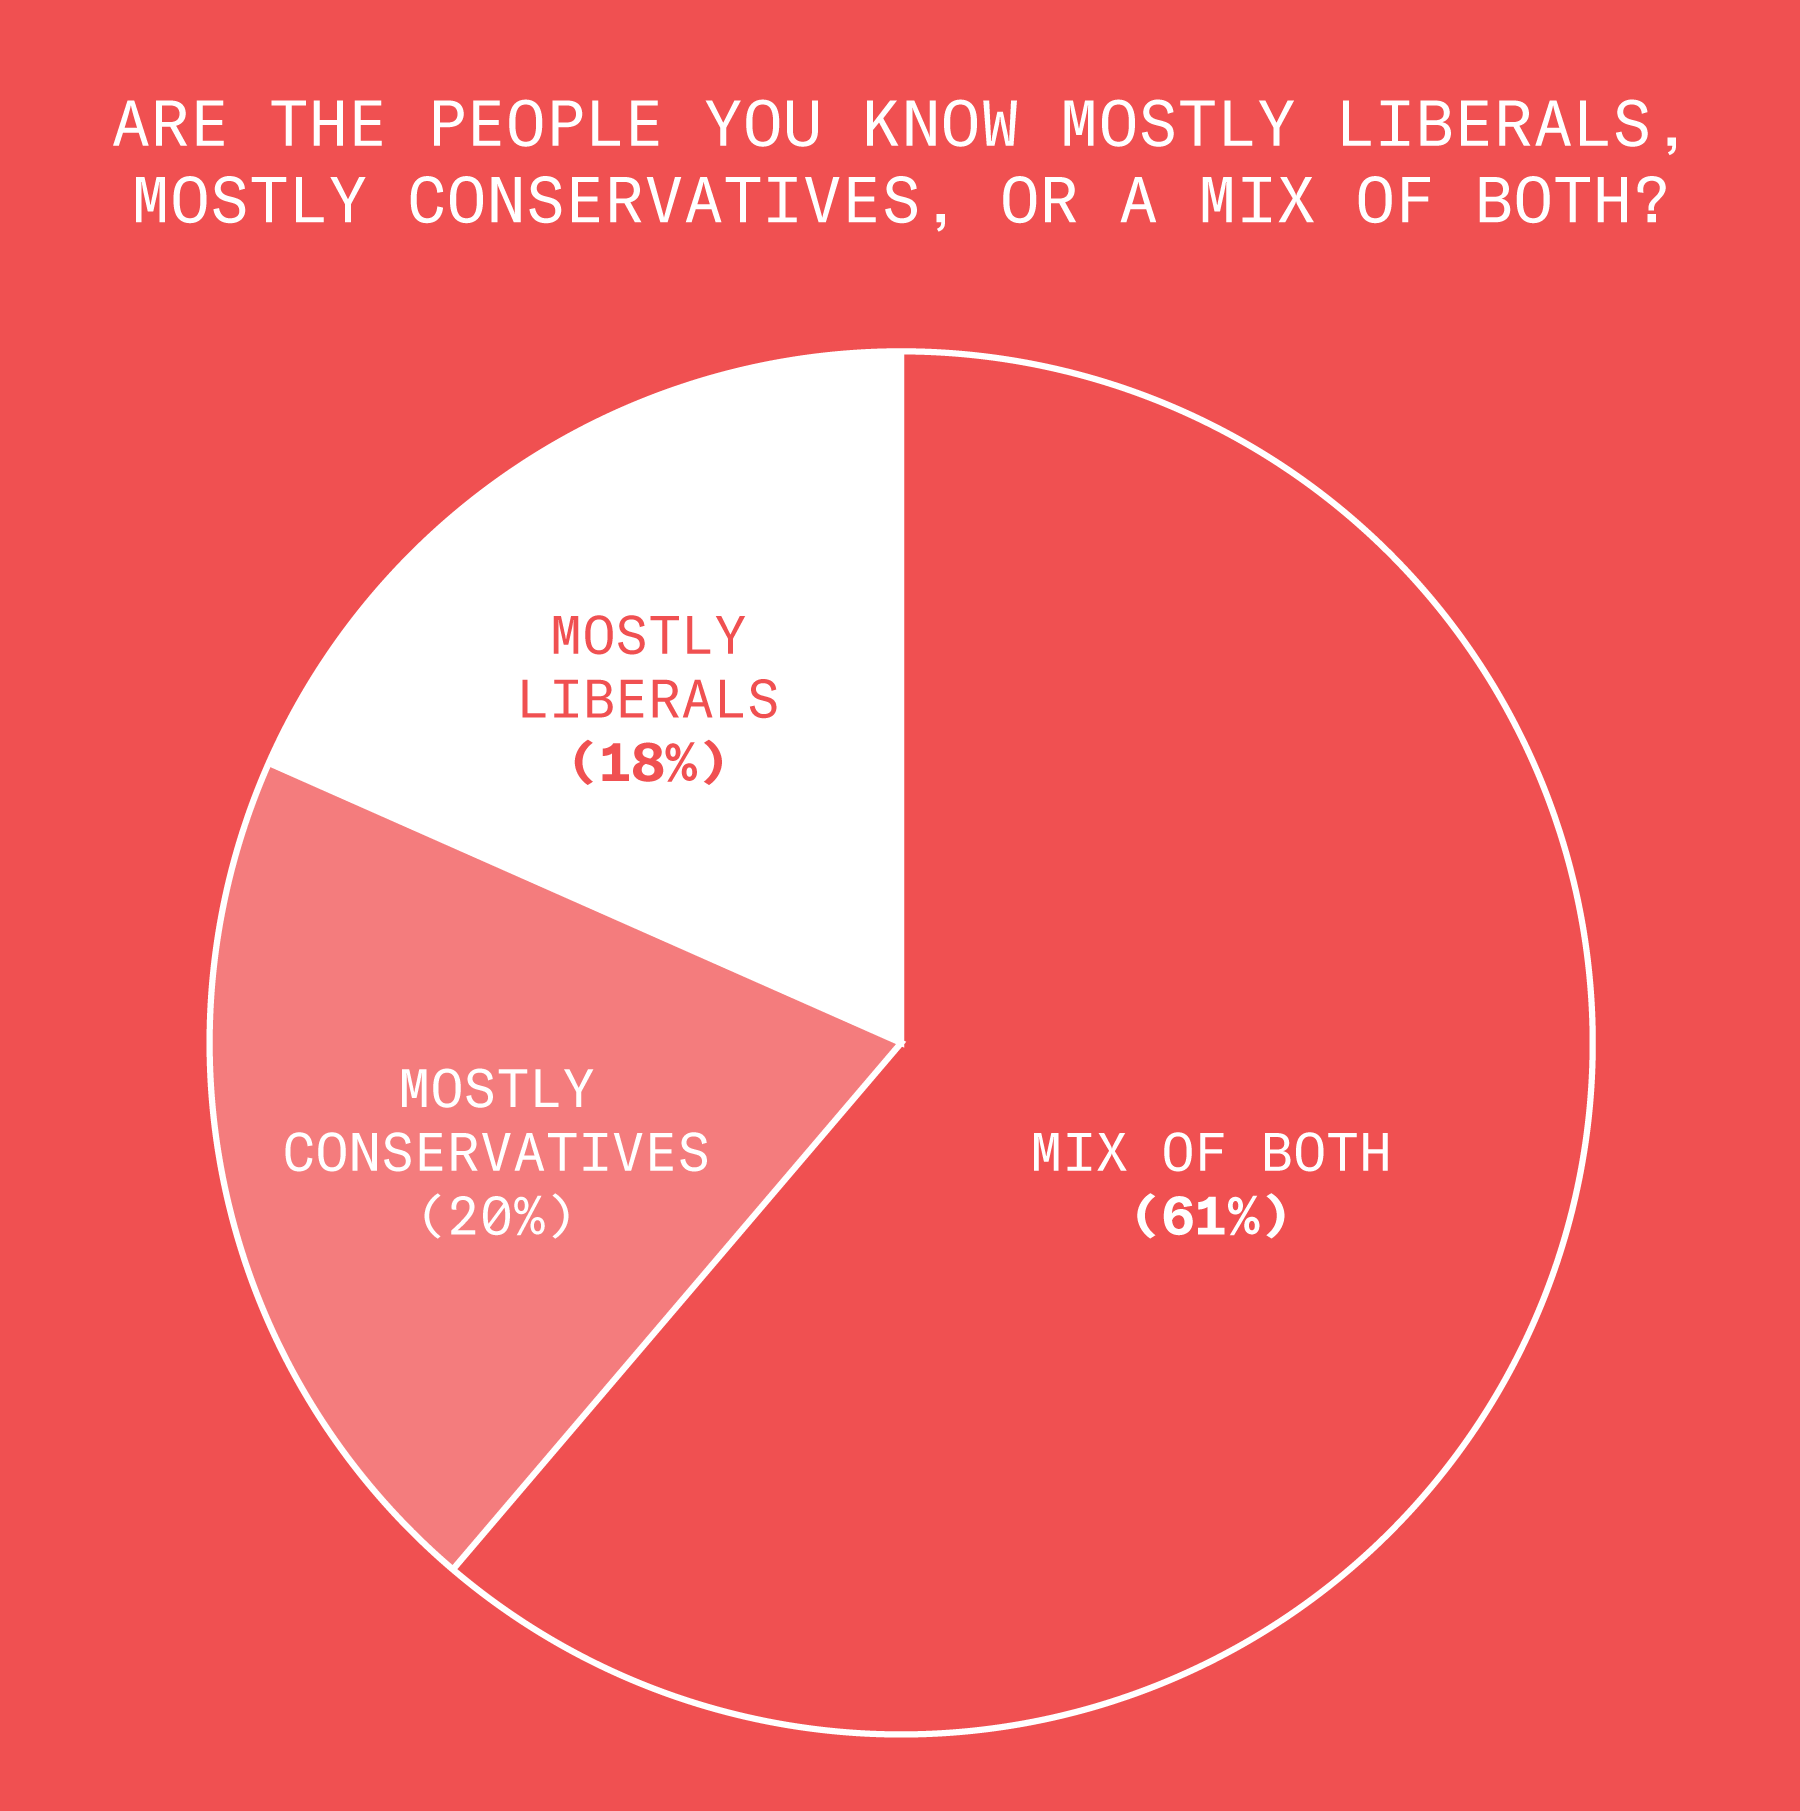
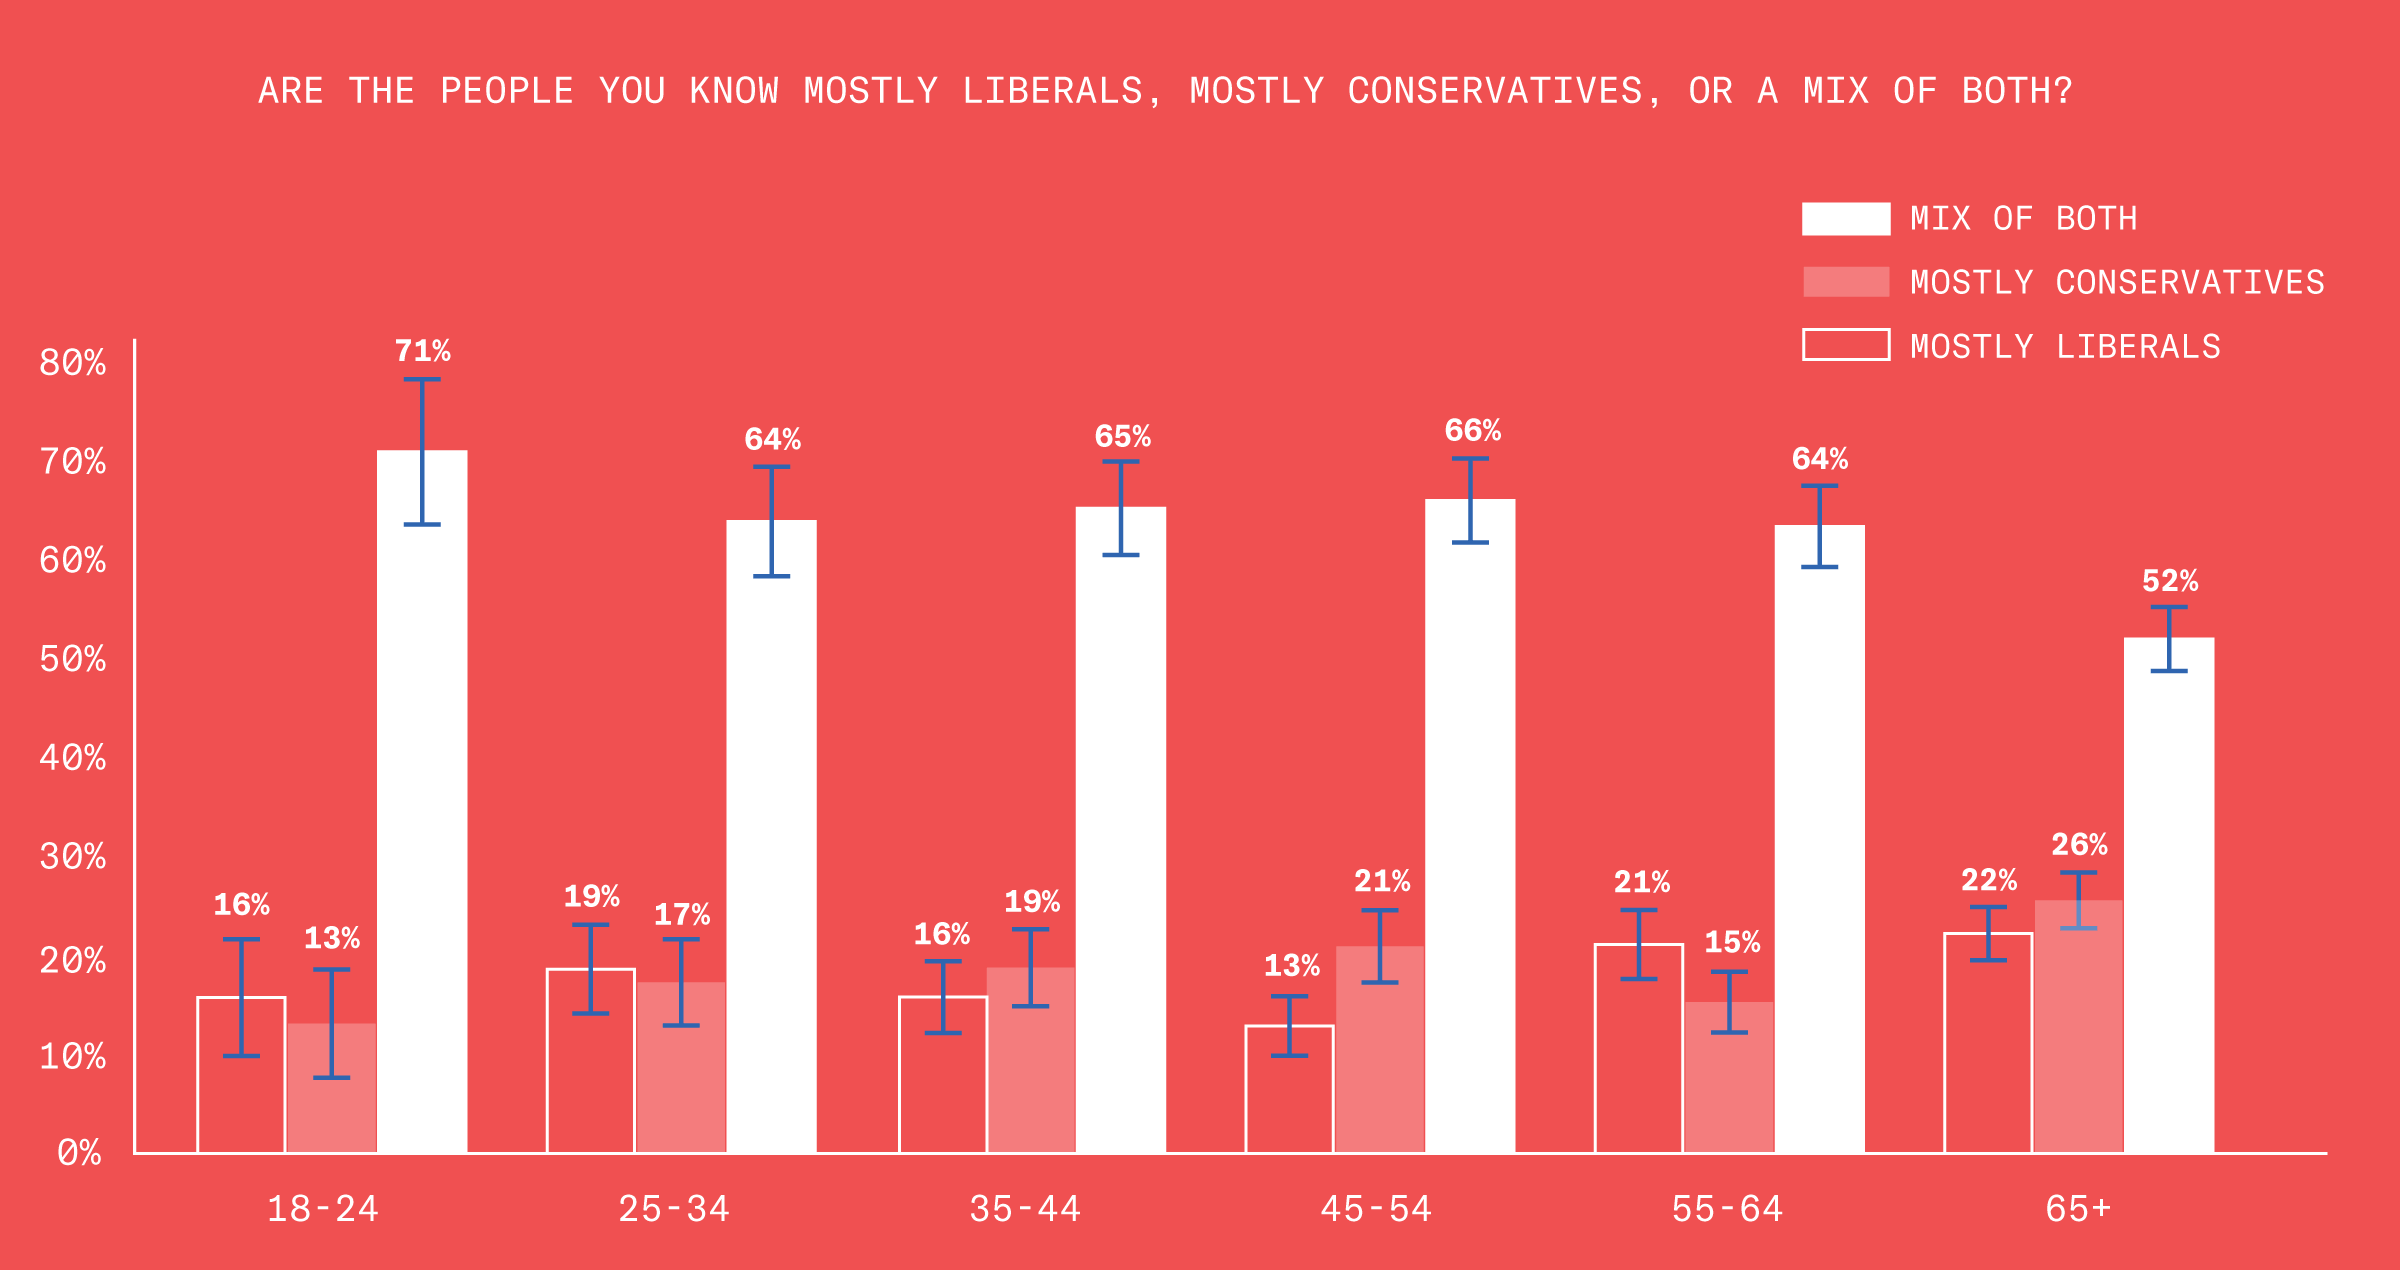
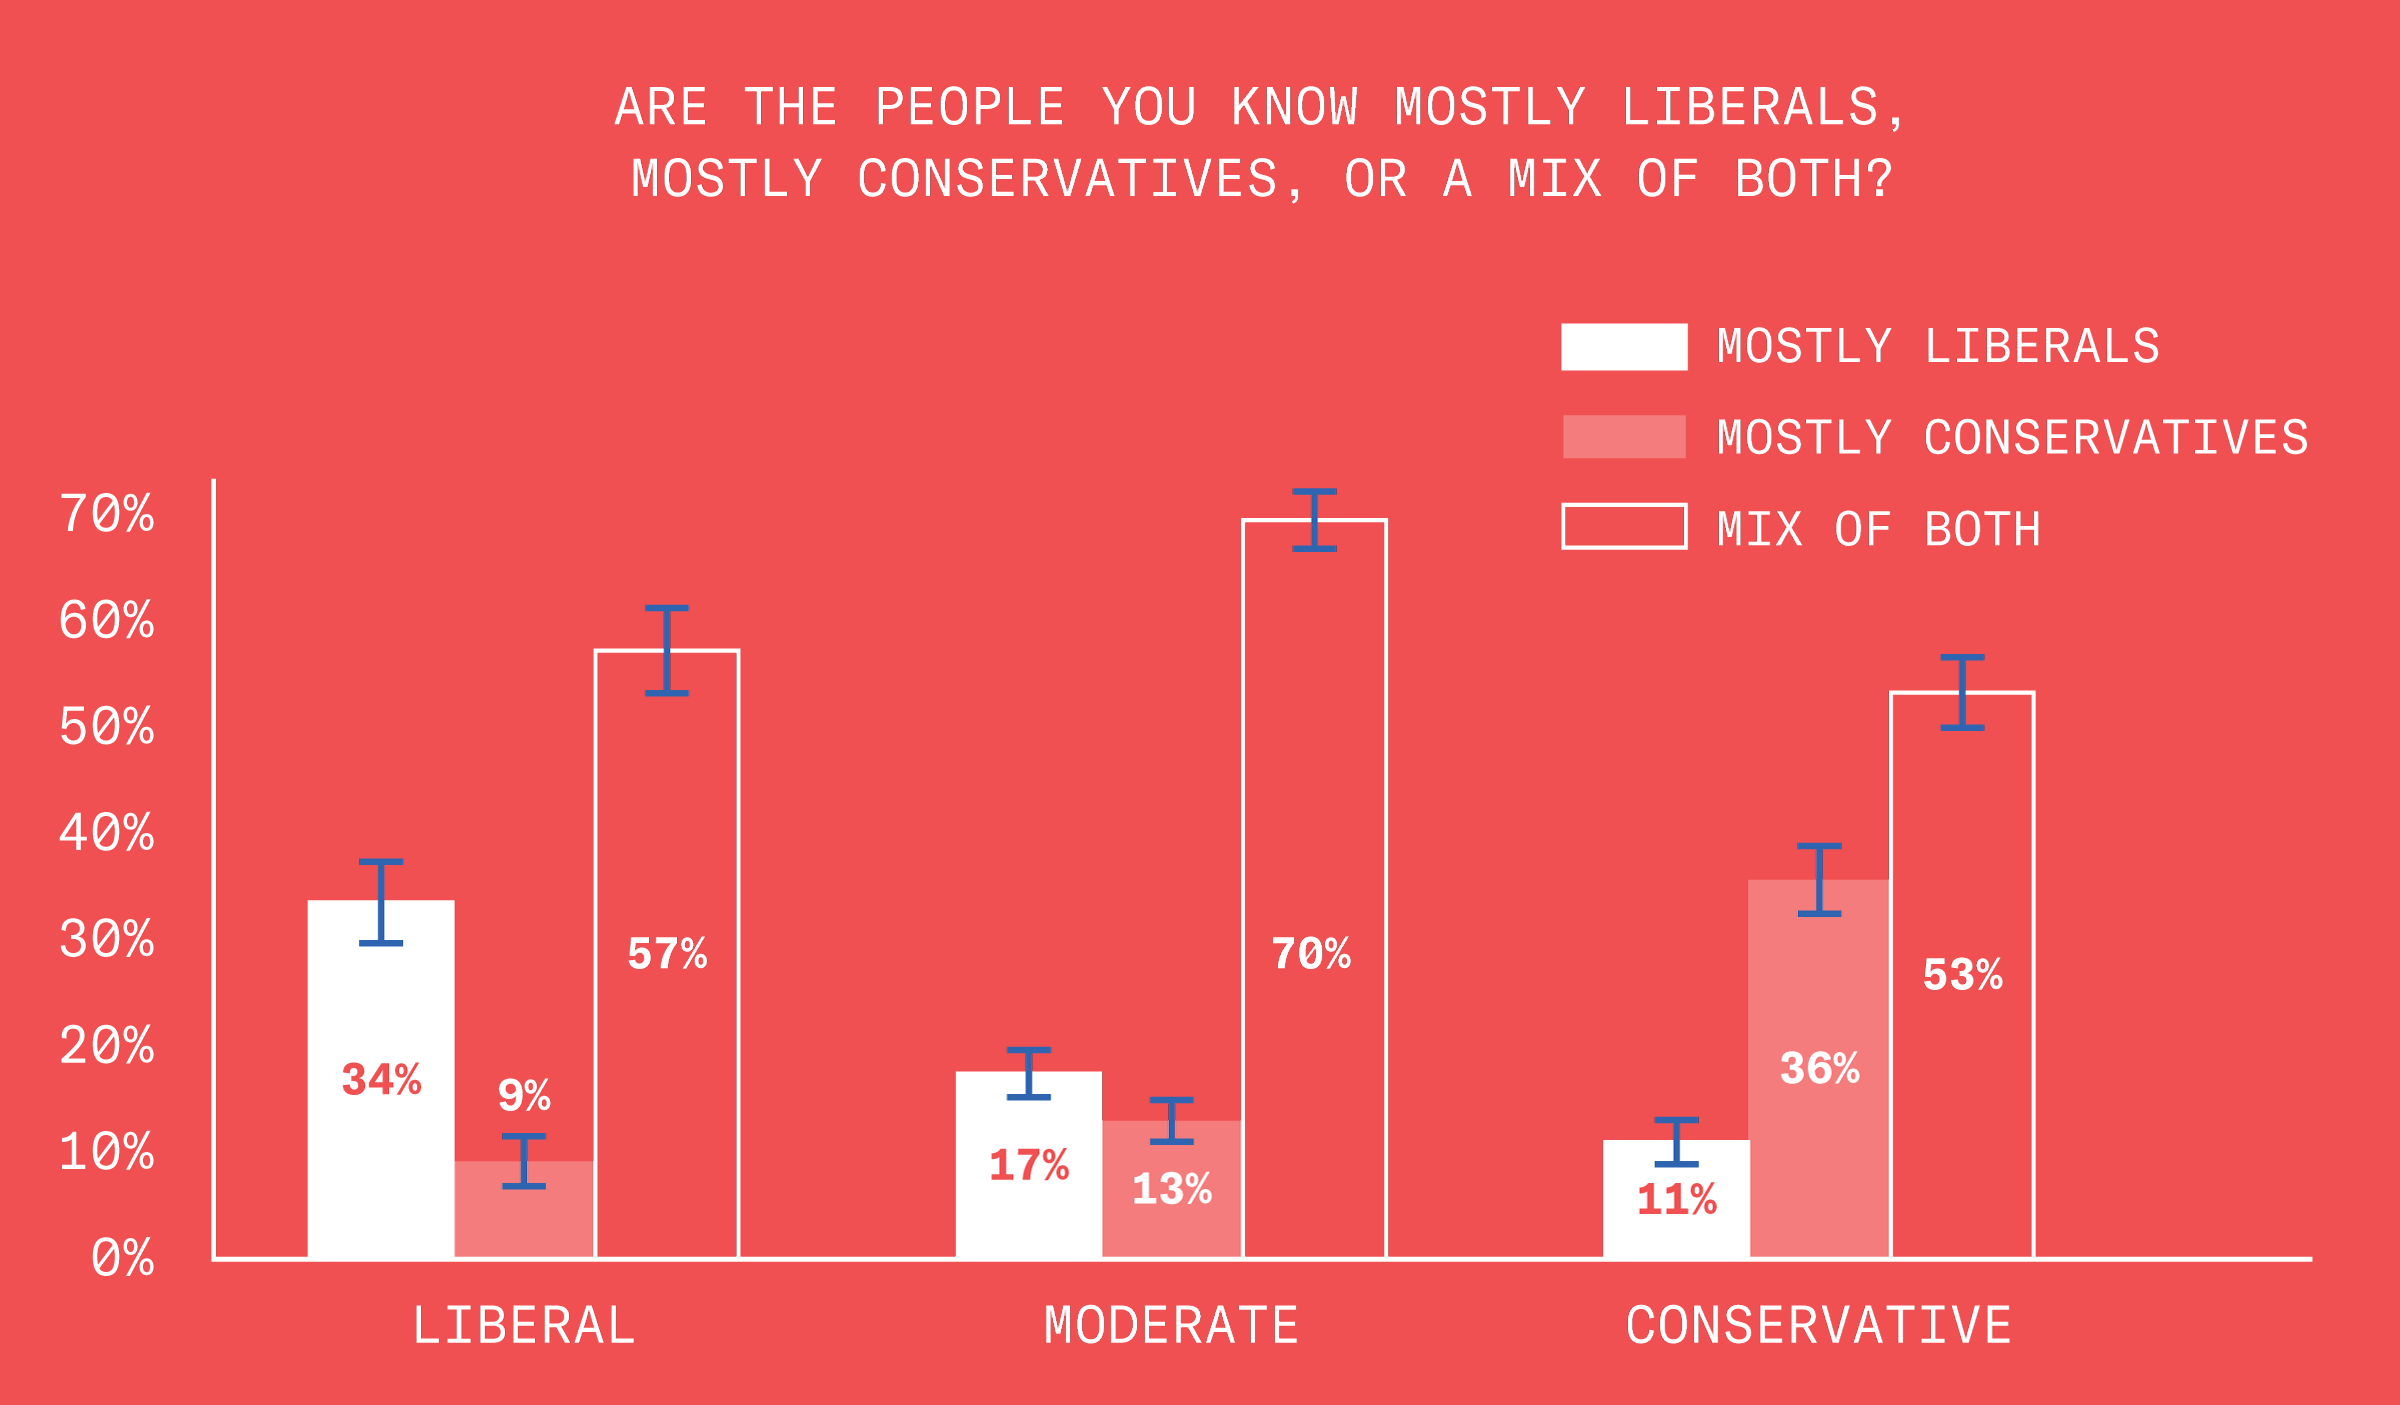
Echo Chambers
Ideological echo chambers aren’t as big of a problem as people think. Alternatively, many people are in profound denial of the fact that they live in ideological echo chambers.
Echo Chambers – 2 of 3
Once you get old, you have no interest in other people’s political opinions.
Echo Chambers – 3 of 3
Liberals and conservatives are about equally likely to live in their own bubbles.
The Truth
Are the allegations of sexual misconduct against Donald Trump true?
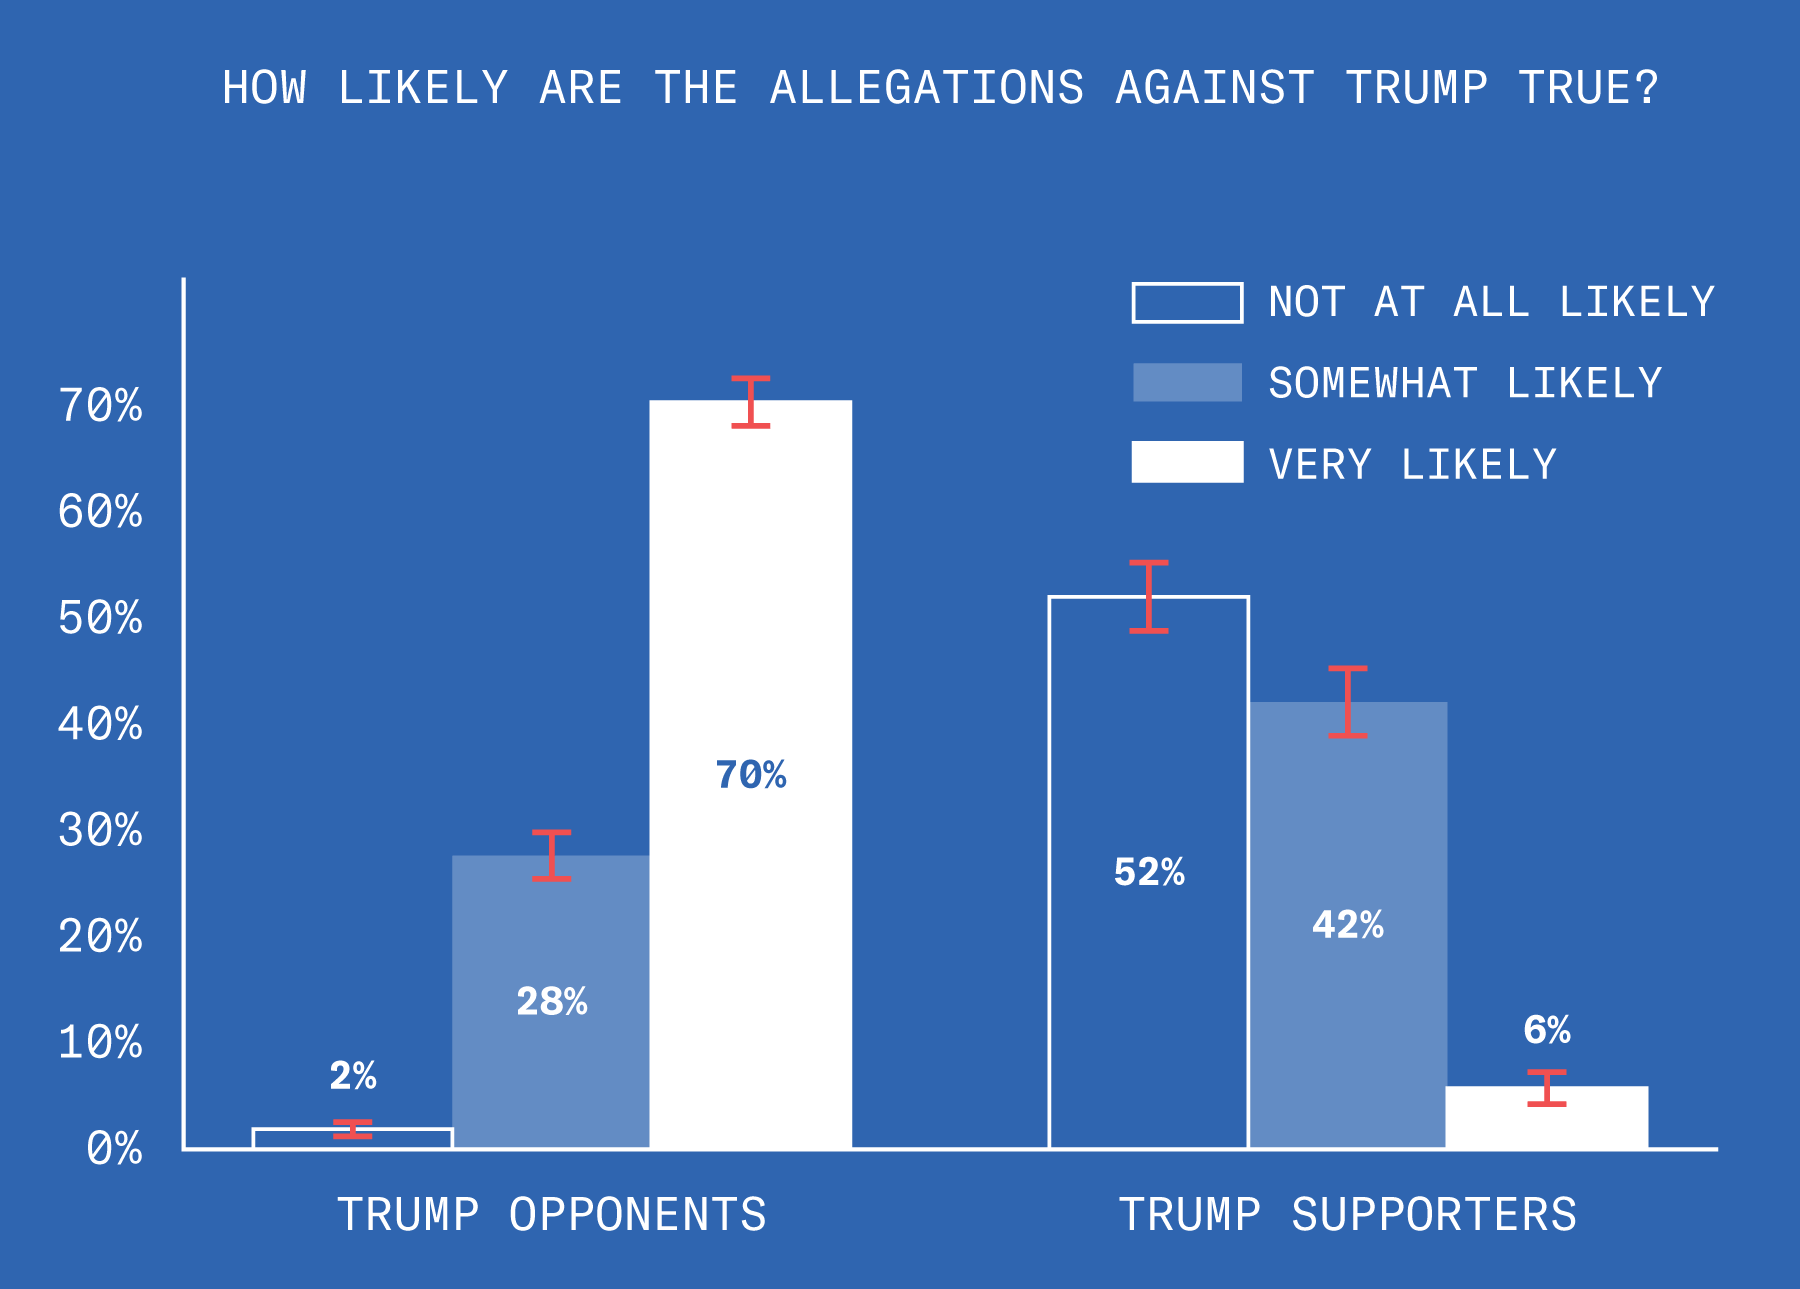
This is pretty much the same question as "Do you support Donald Trump?"
The Truth – 2 of 3
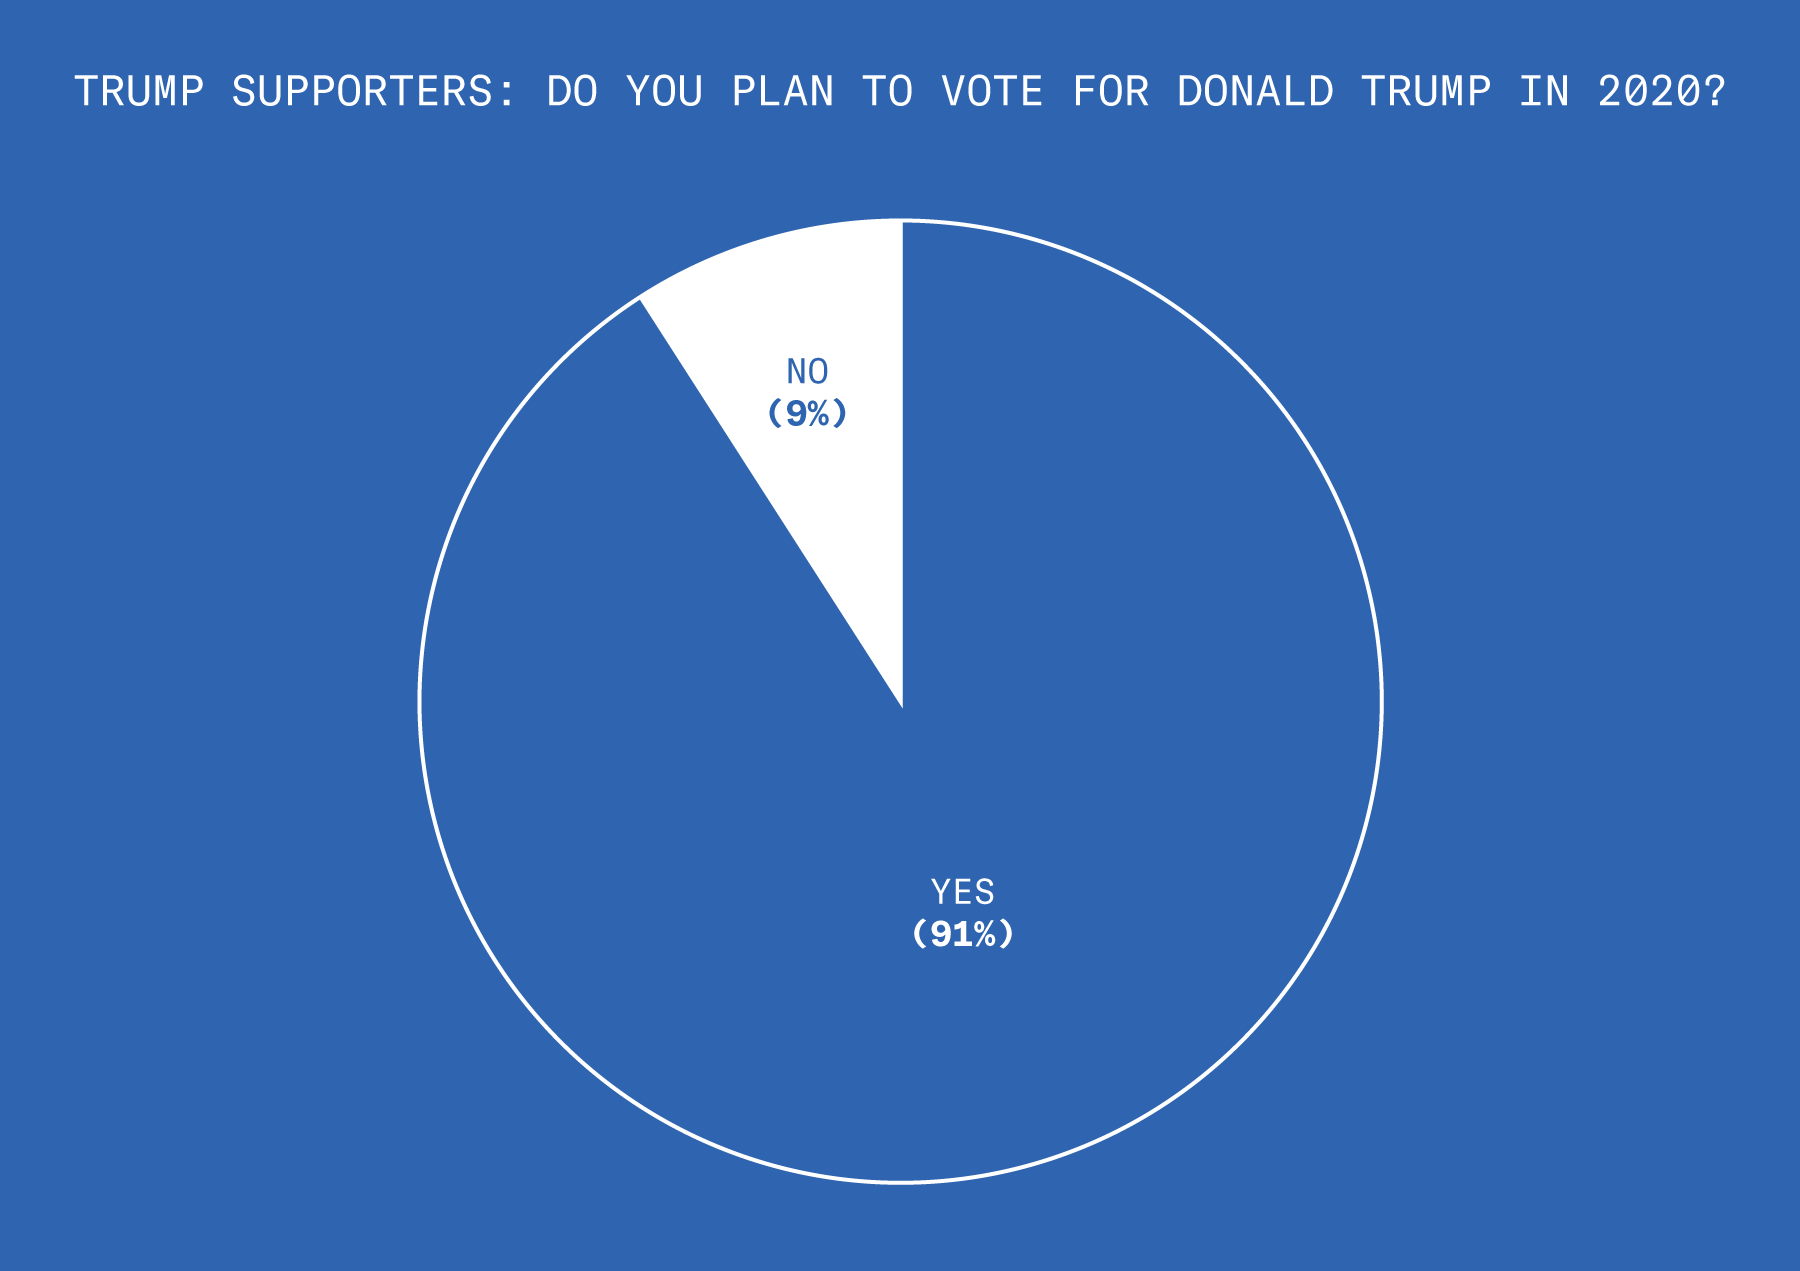
Are Trump supporters planning on voting for Trump again in 2020? Of course they are.
The Truth – 3 of 3
We asked those people if they would still vote for Trump if he murdered a journalist who was spreading harmful lies.
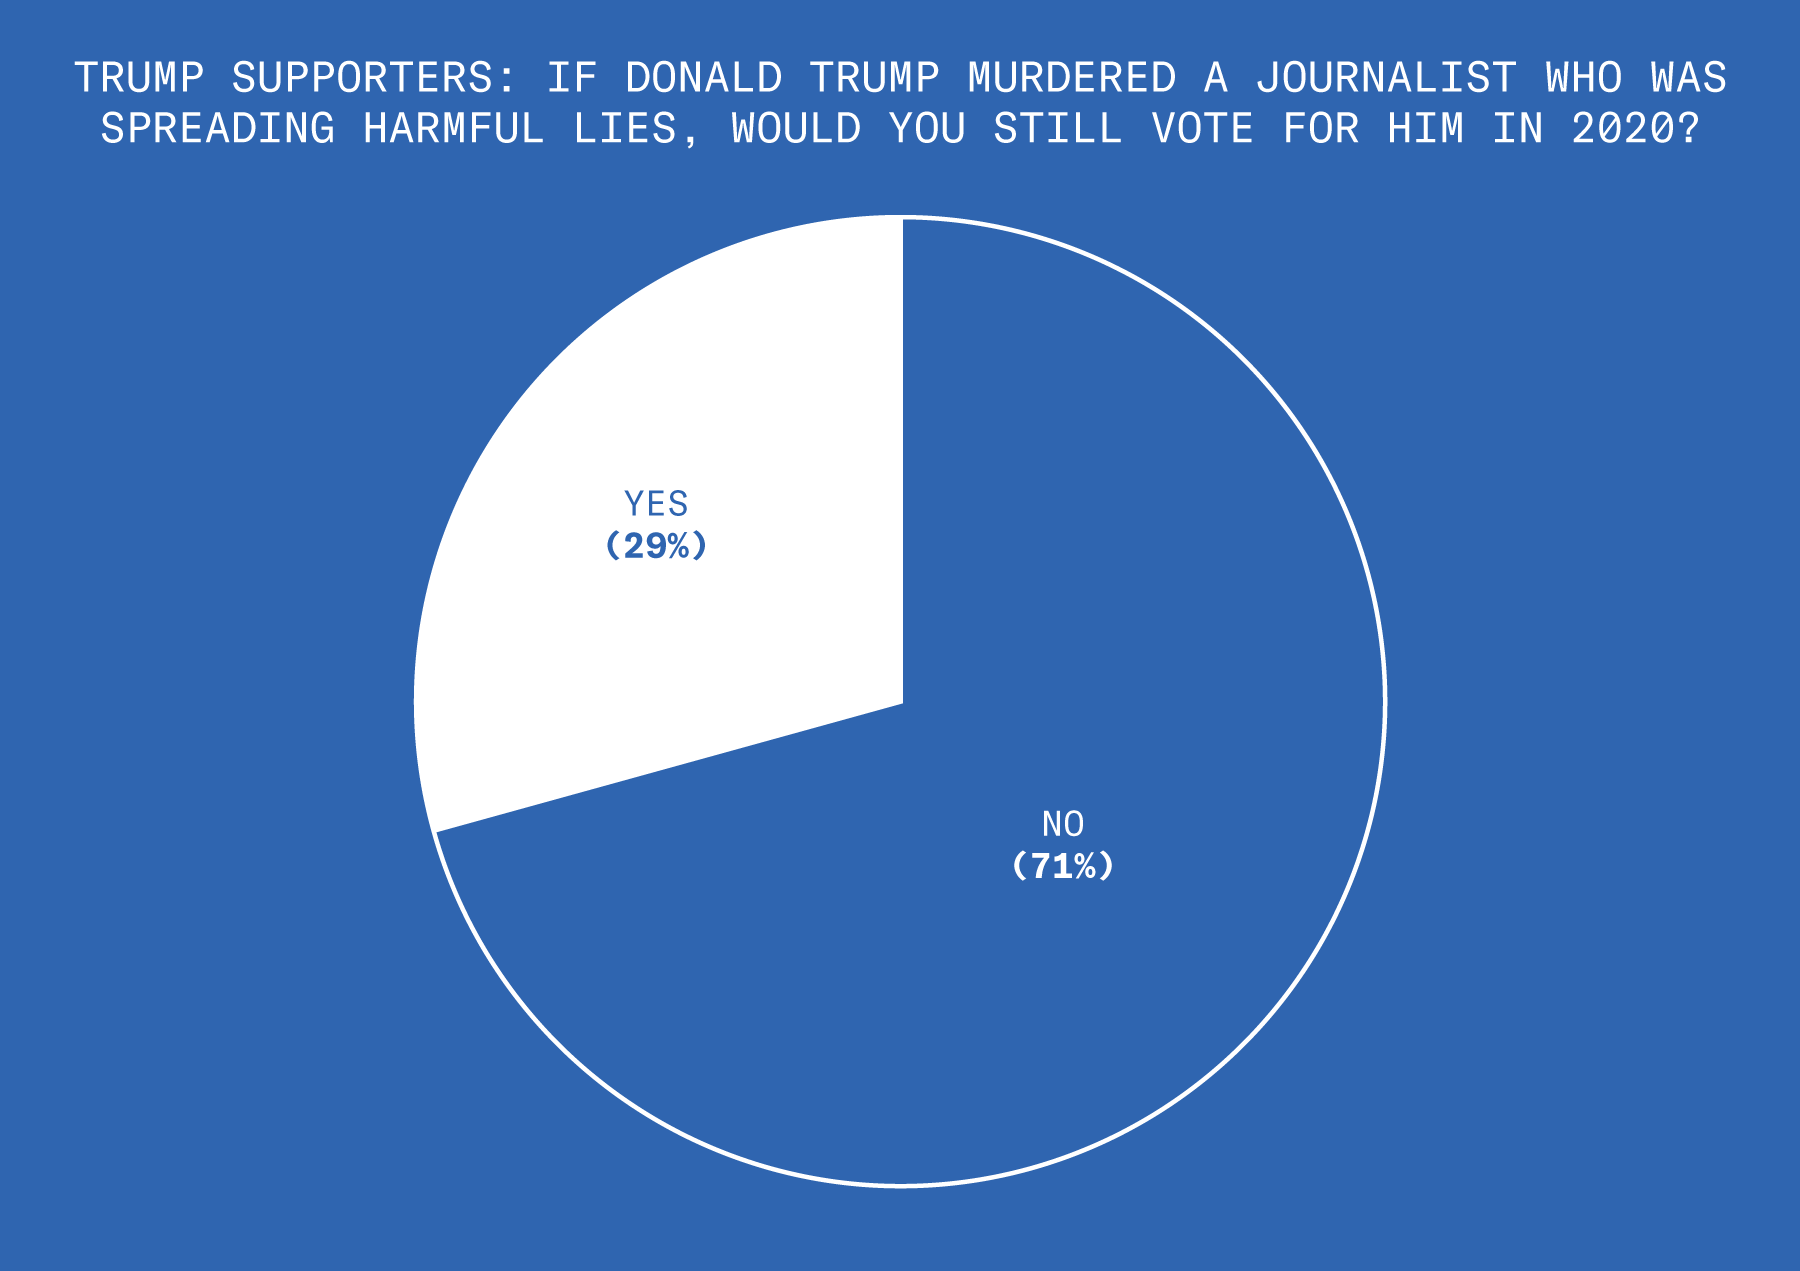
About 3 in 10 would stick with the guy. You could either think of that as terrifying or reassuring.
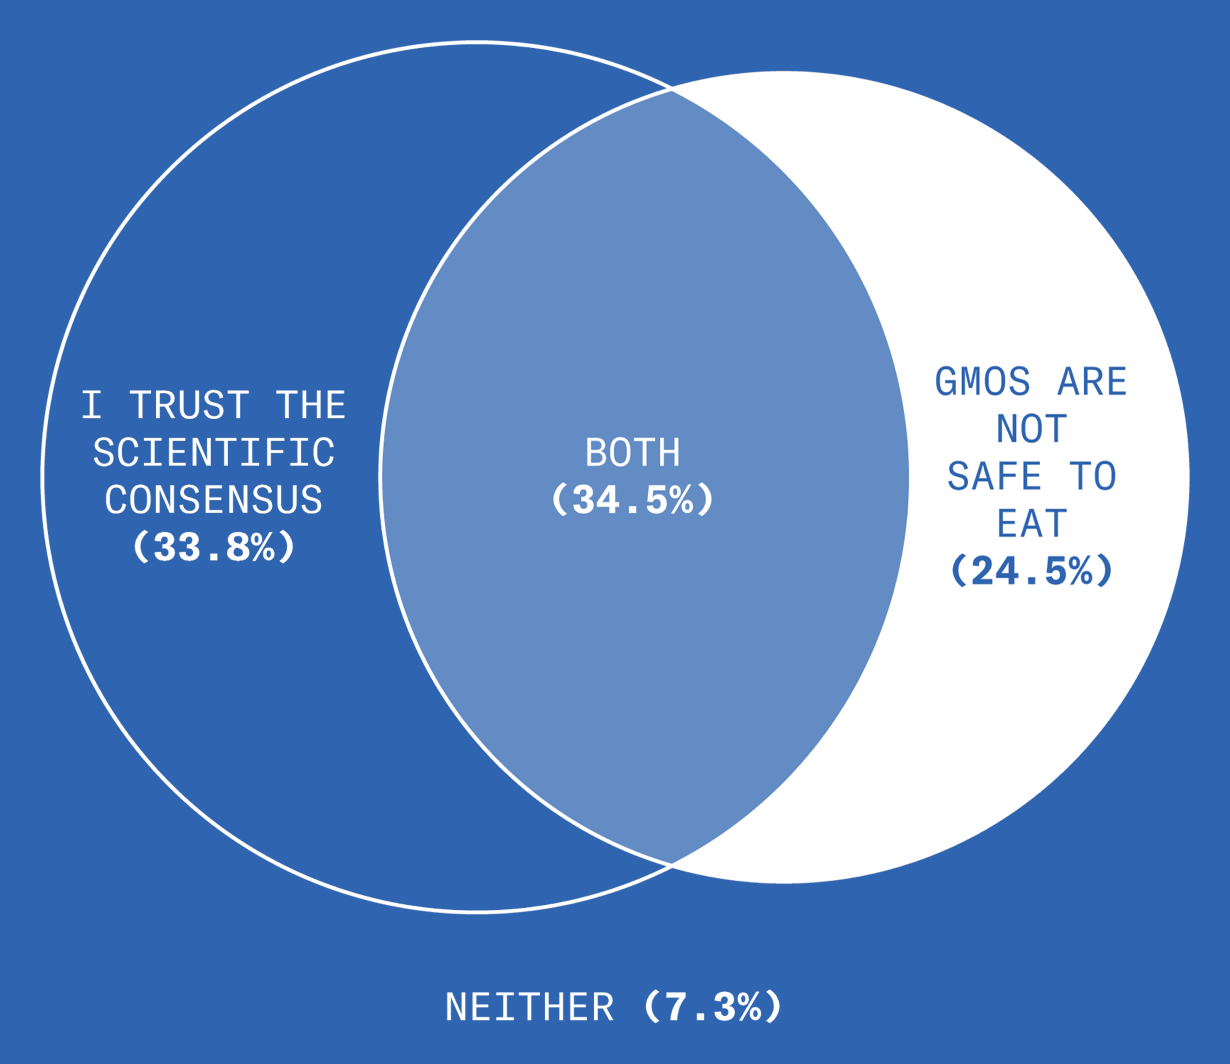
Science!
Democrats are all about “science!” Especially if it has an exclamation point.
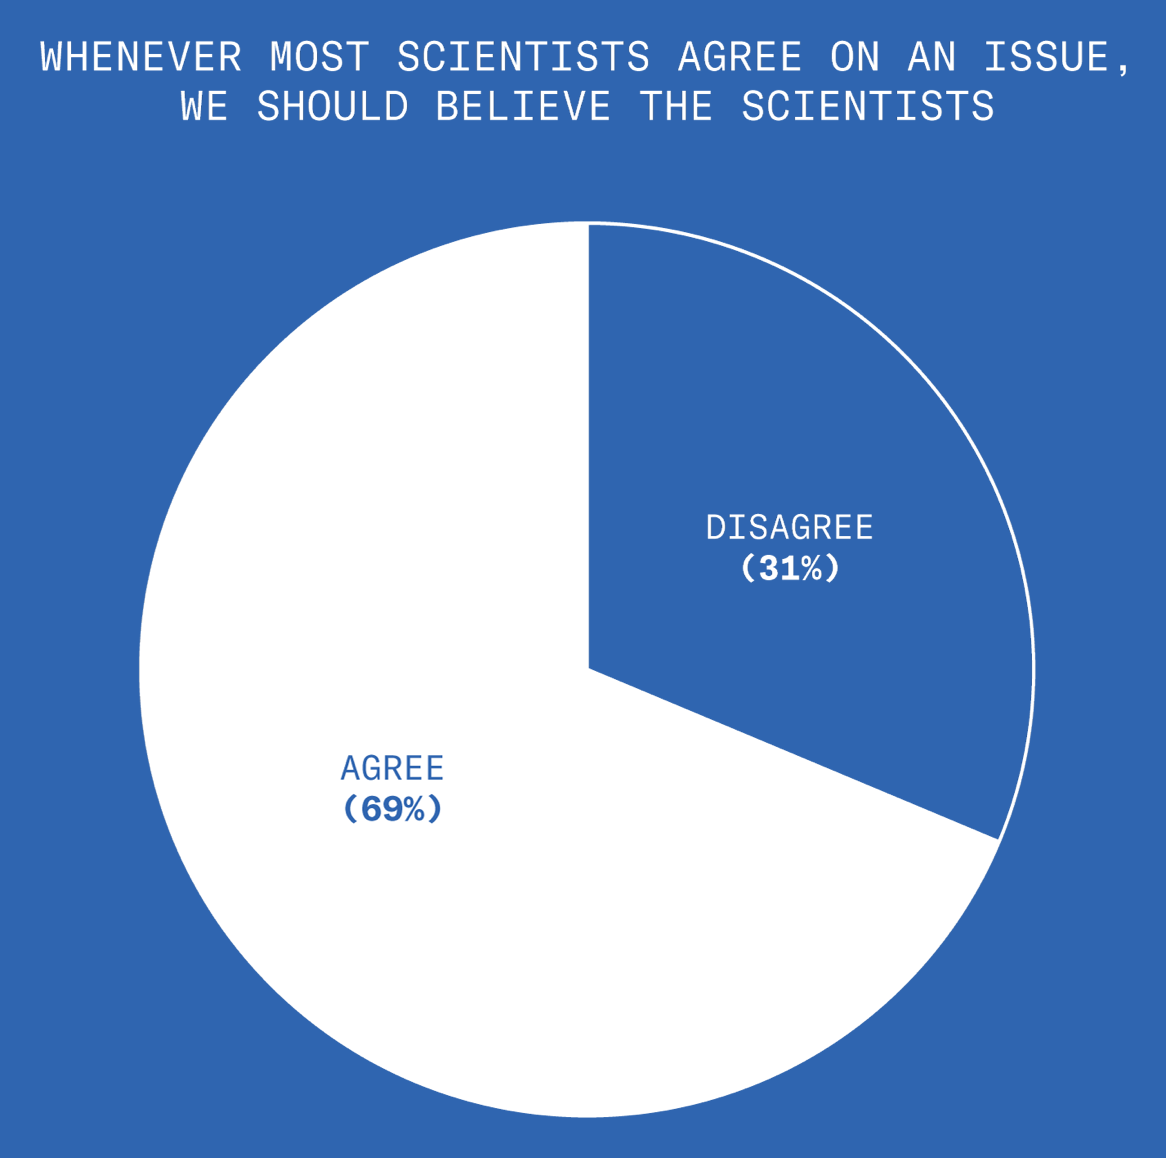
Science! – 2 of 3
But when it comes to the scientific consensus that GMOs are safe to eat, Democrats are less like “science!” and more like “science?”
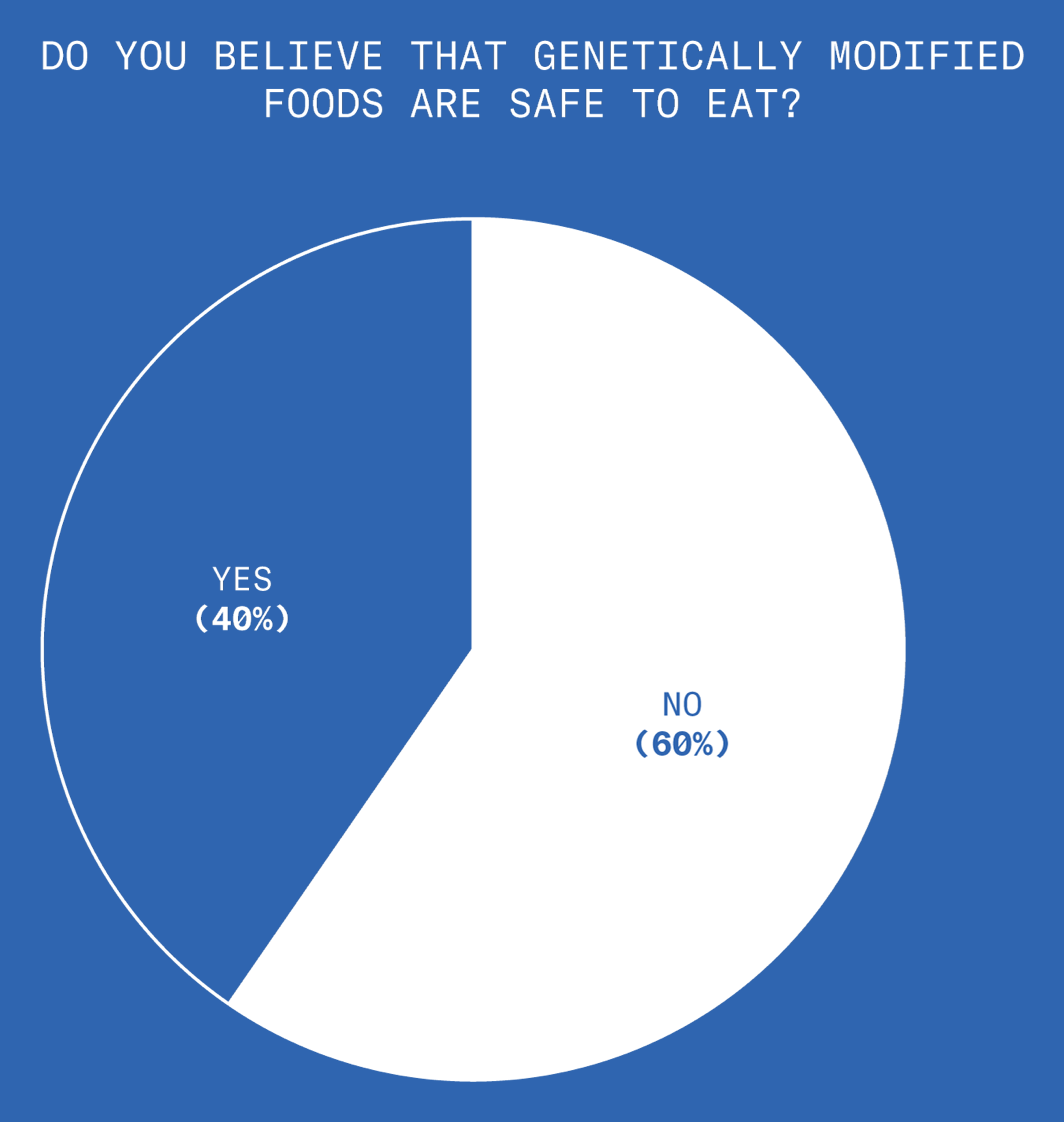
Science! – 3 of 3
One in three Democrats think that they trust scientific consensus but actually do not.
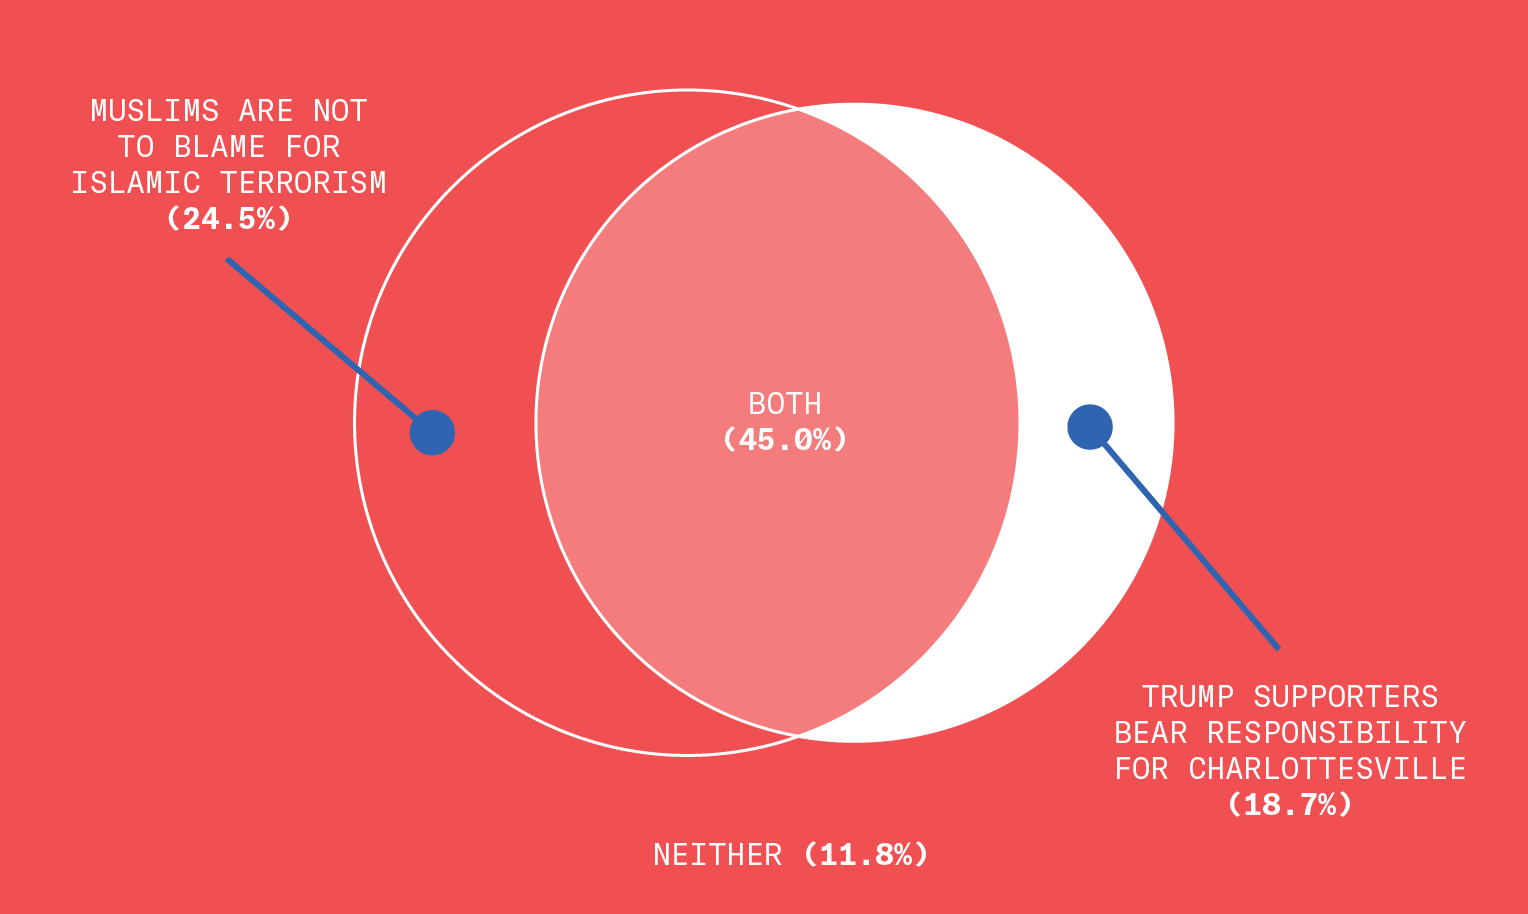
Collective Blame
Should we blame all Muslims for terrorist attacks committed in the name of Islam? Most Democrats say no, because blaming an entire group of people for violence committed by a fringe minority is a textbook example of prejudice.

Collective Blame – 2 of 3
Should we blame all Trump supporters for the domestic terrorist attack in Charlottesville? Sure, fuck those guys!
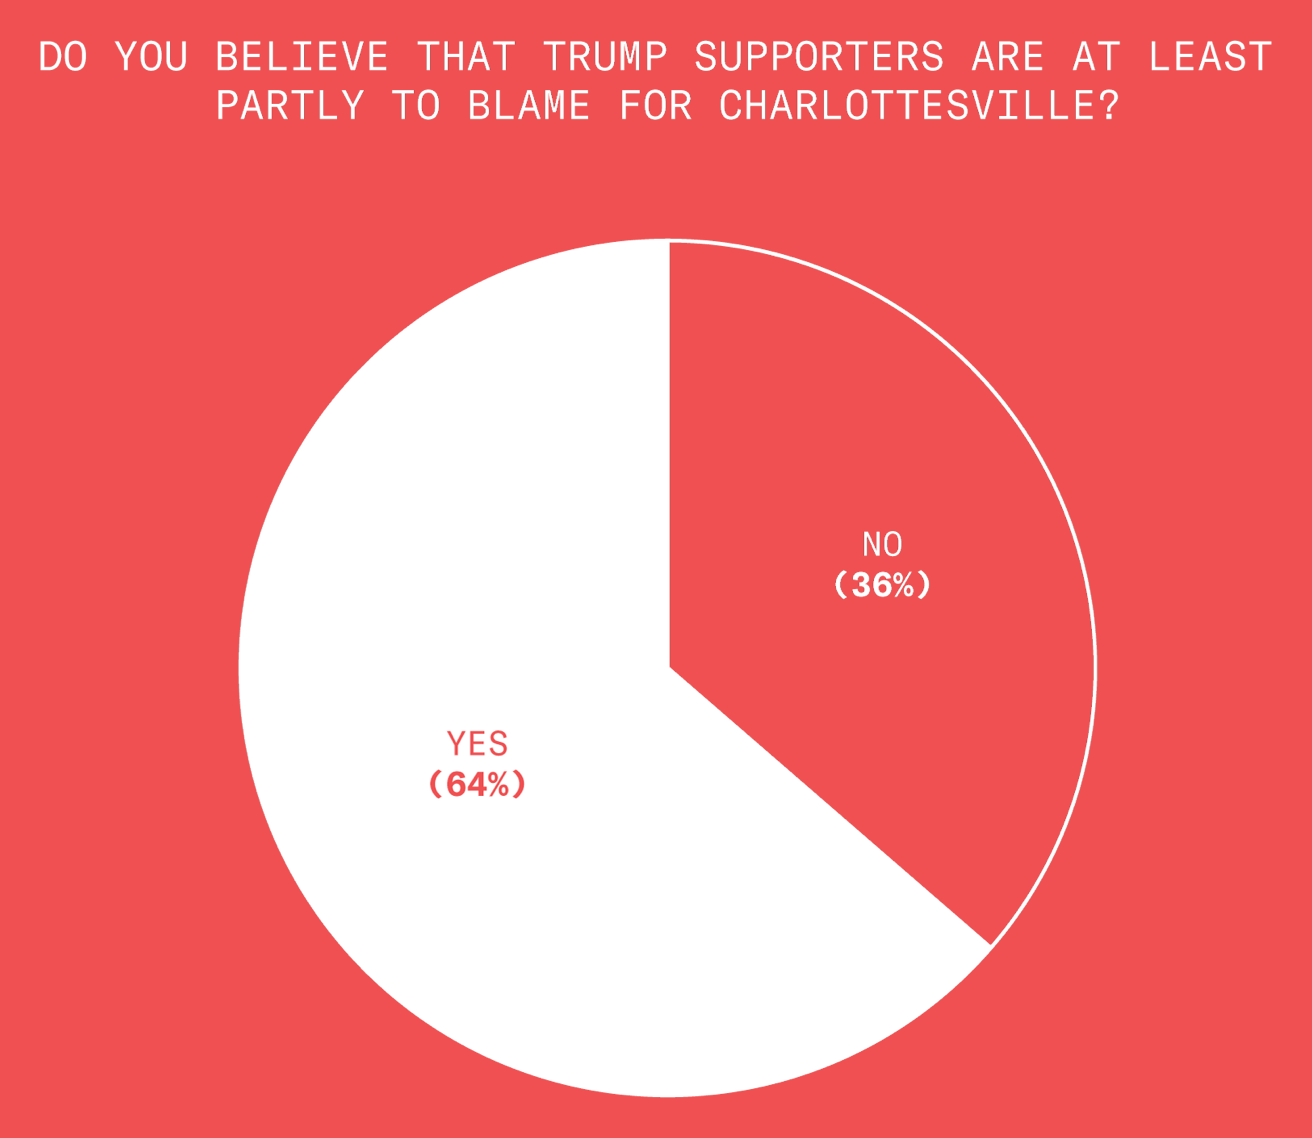
Collective Blame – 3 of 3
I see no problem here.
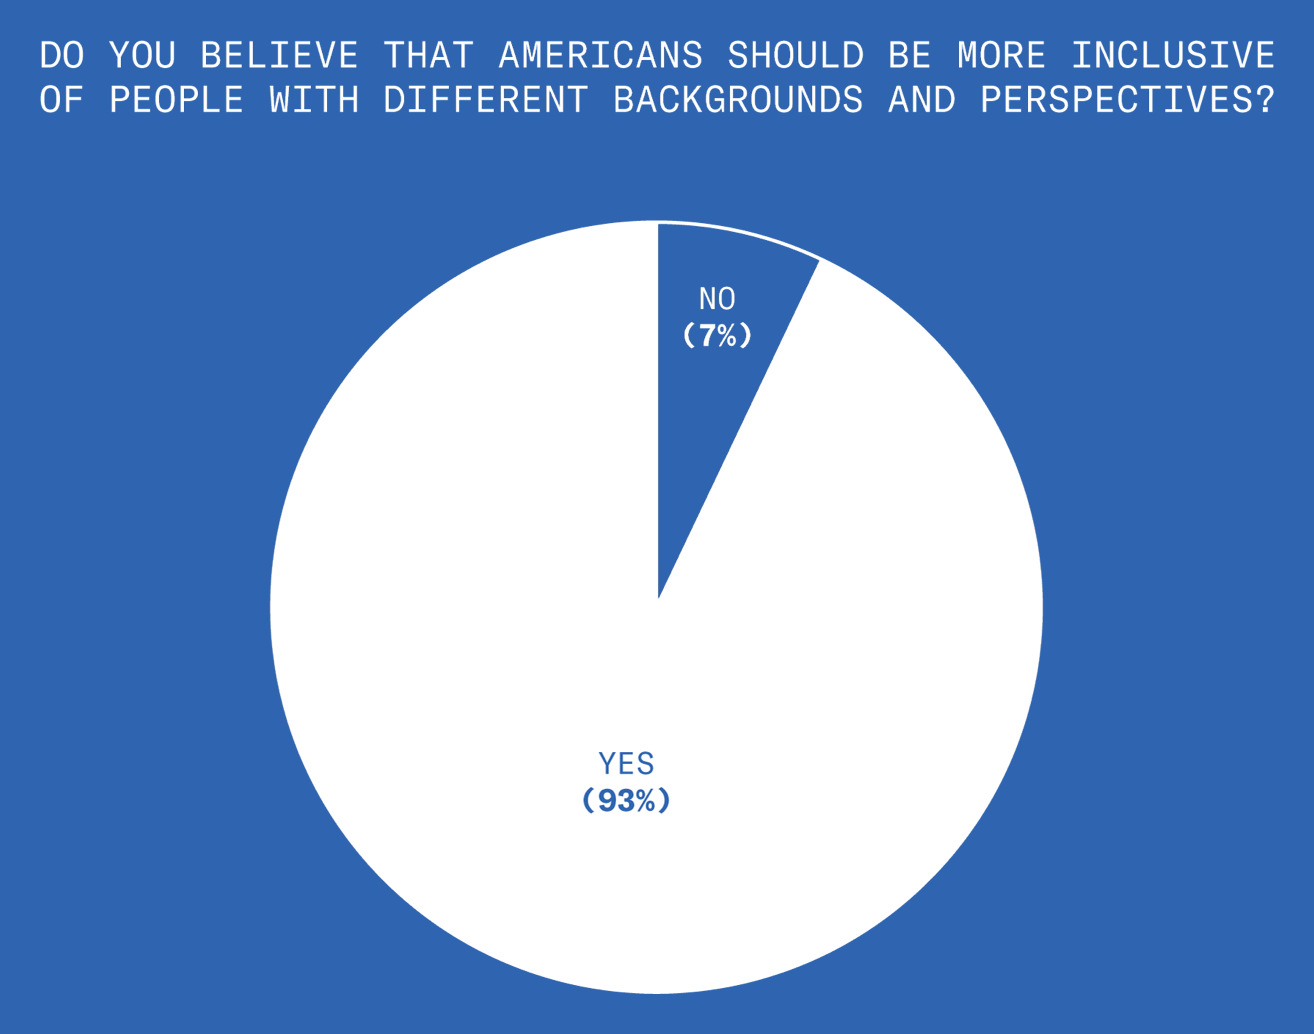
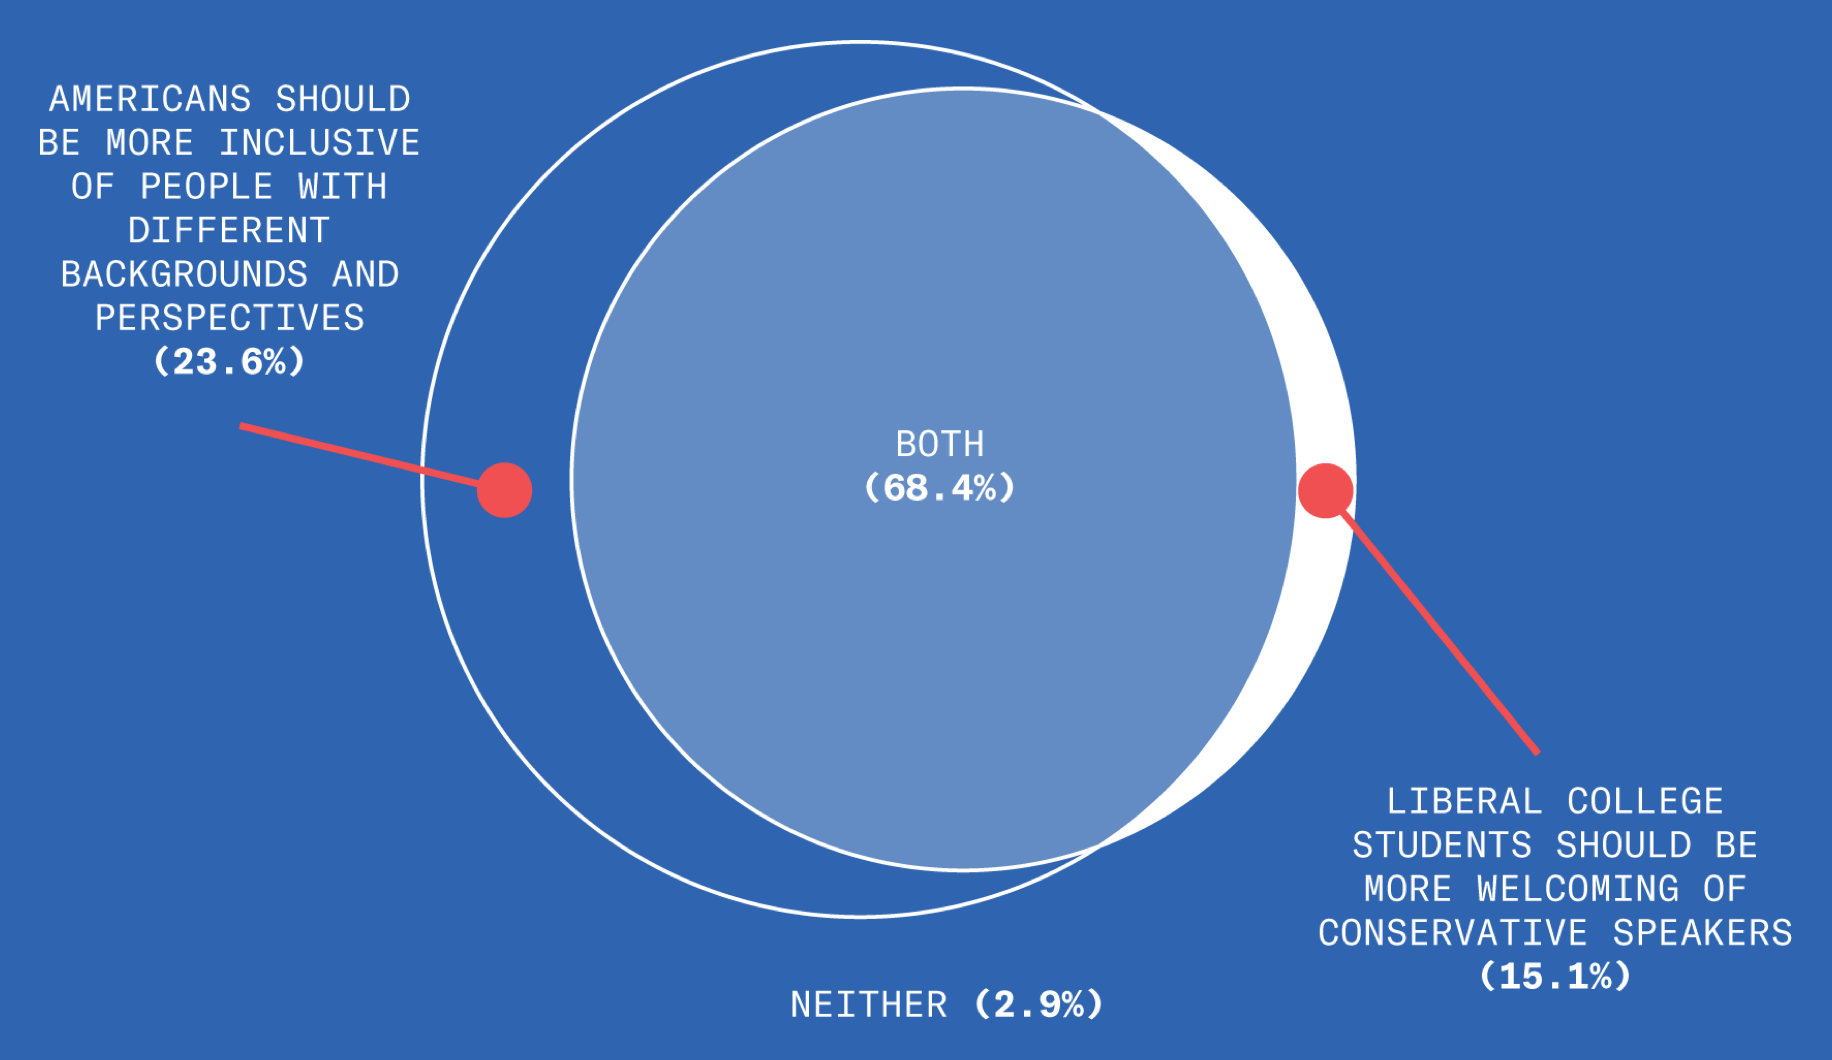
Inclusivity
Democrats are nearly unanimous in their support for including people with different backgrounds and perspectives.
Inclusivity – 2 of 5
Most Democrats also think college students should be more inclusive of conservative speakers on college campuses. How about that.
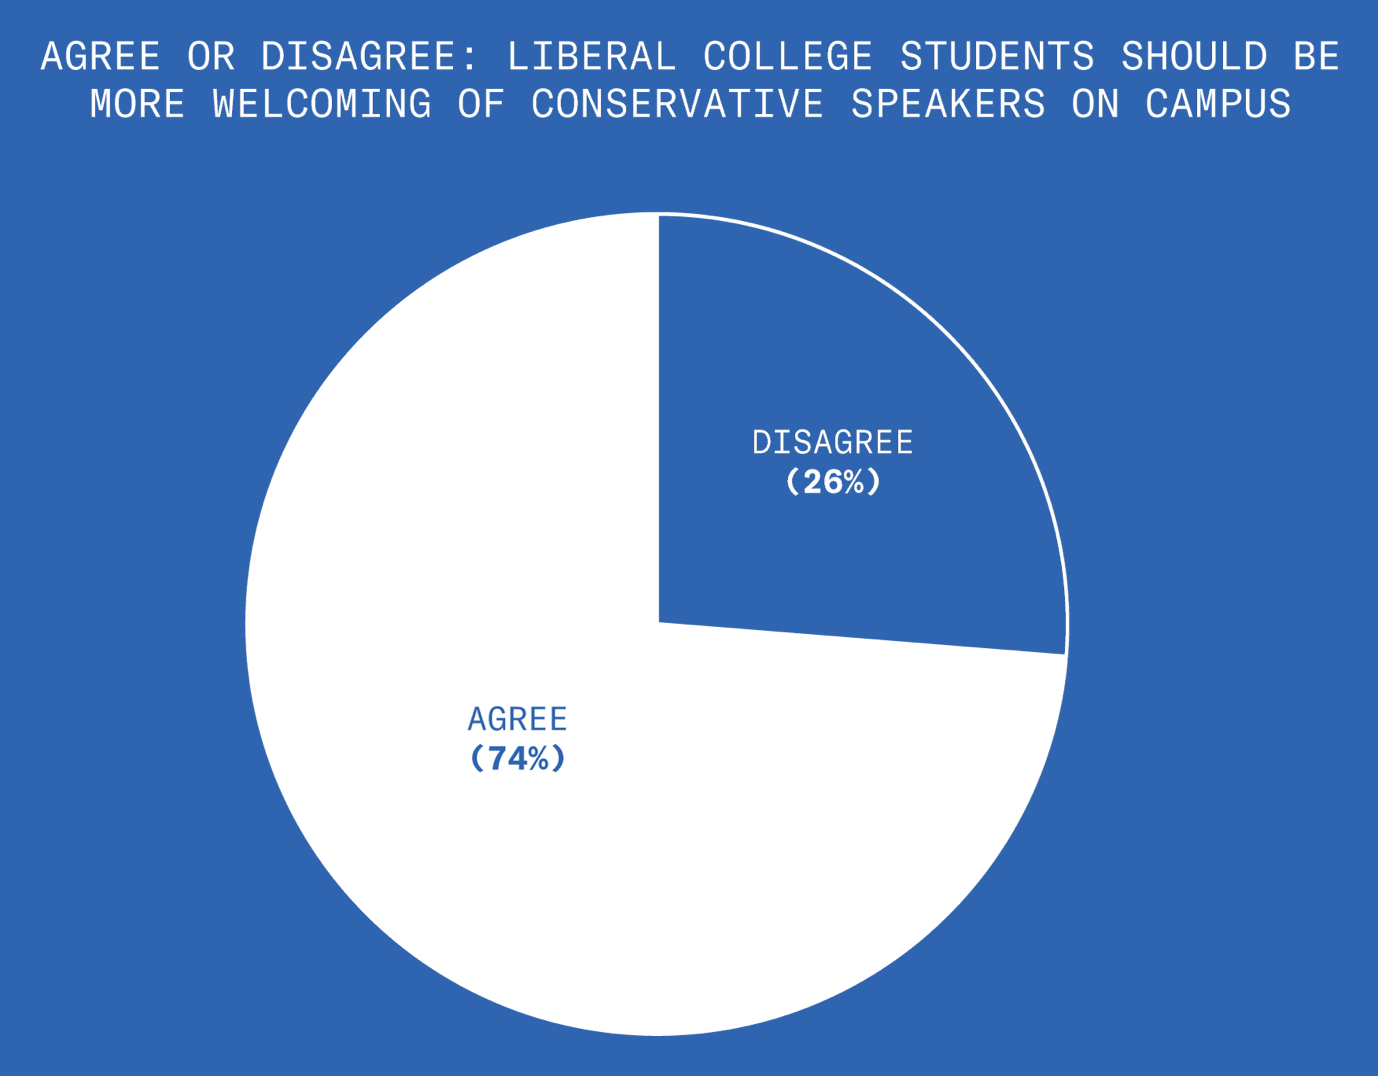
Inclusivity – 3 of 5
Wow, ideological consistency! You don’t see that everyday.
Inclusivity – 4 of 5
But should liberals extend this spirit of inclusivity to Trump Supporters? Democrats are pretty split on this.
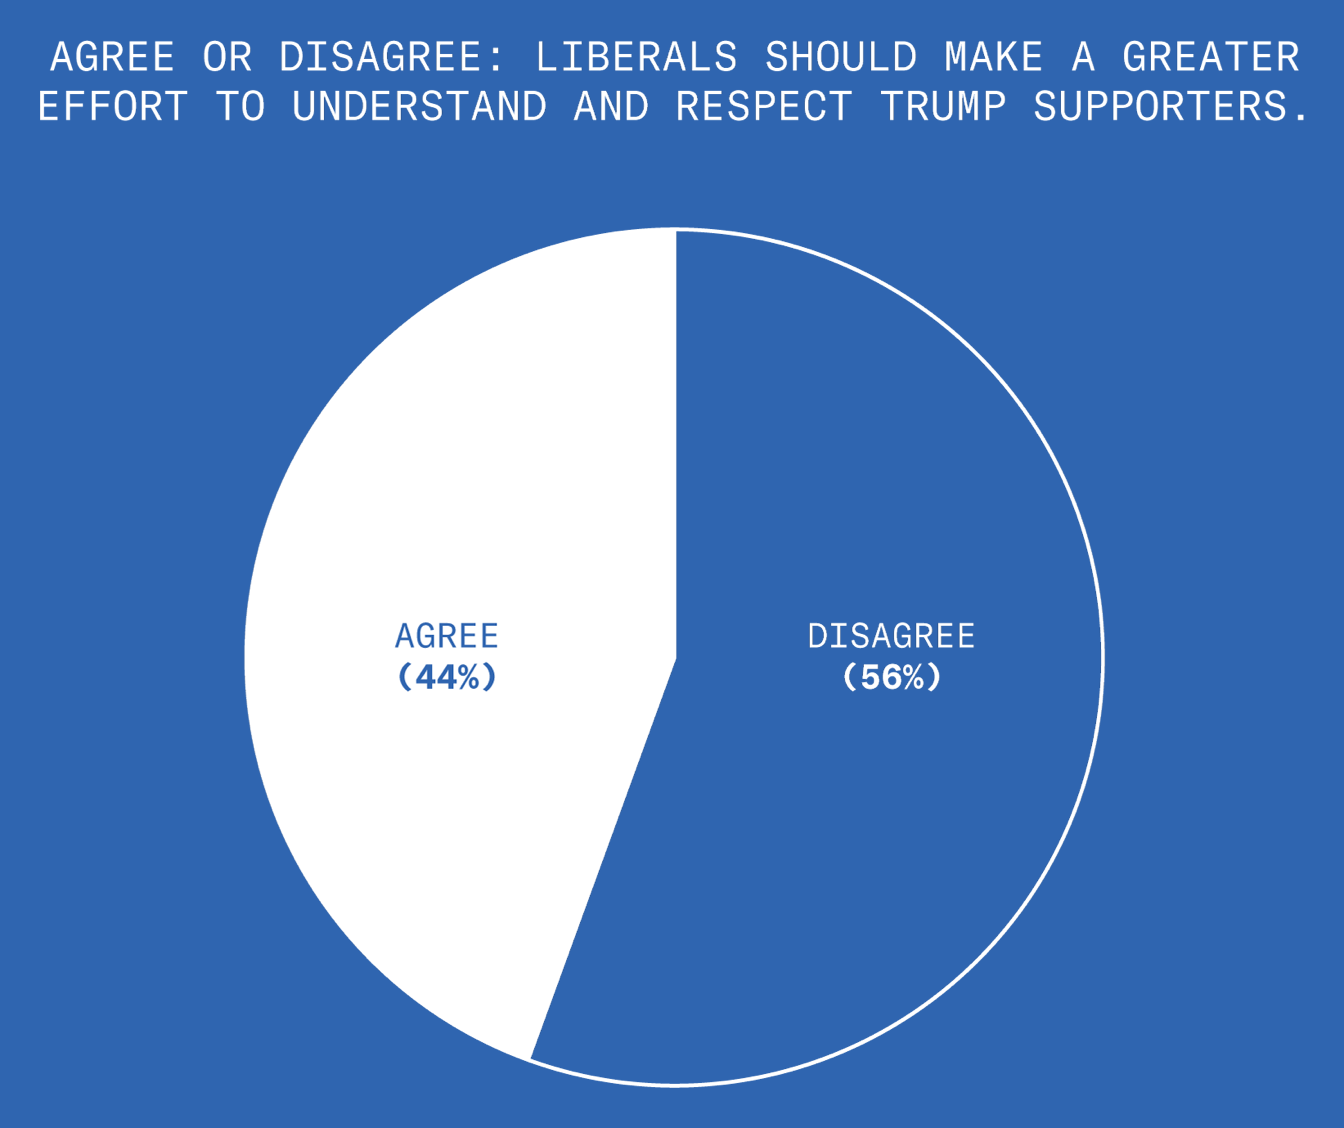
Inclusivity – 5 of 5
That’s probably because they’re also split on whether most Trump supporters are racist.

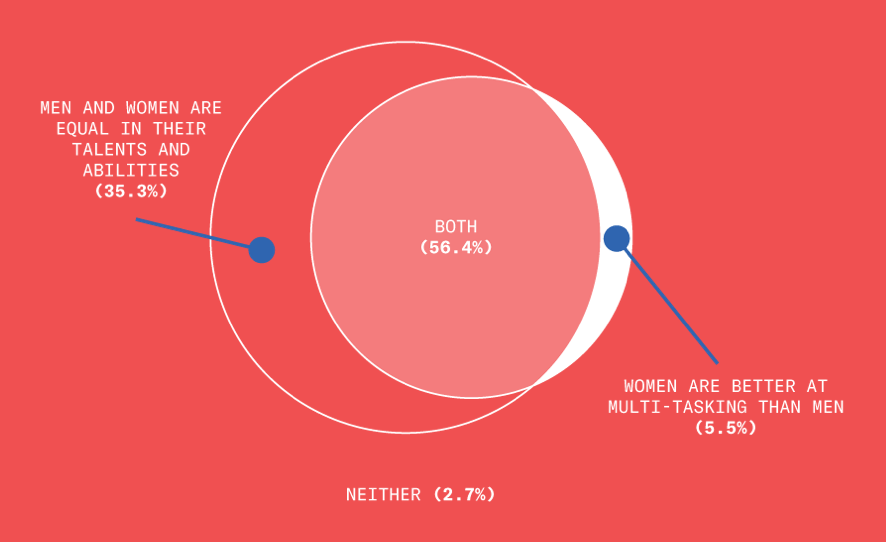
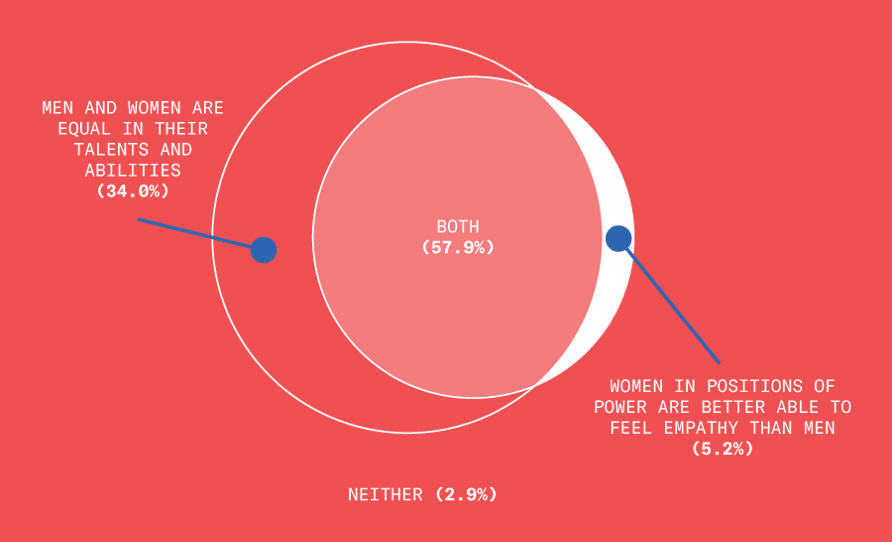
Gender Equality
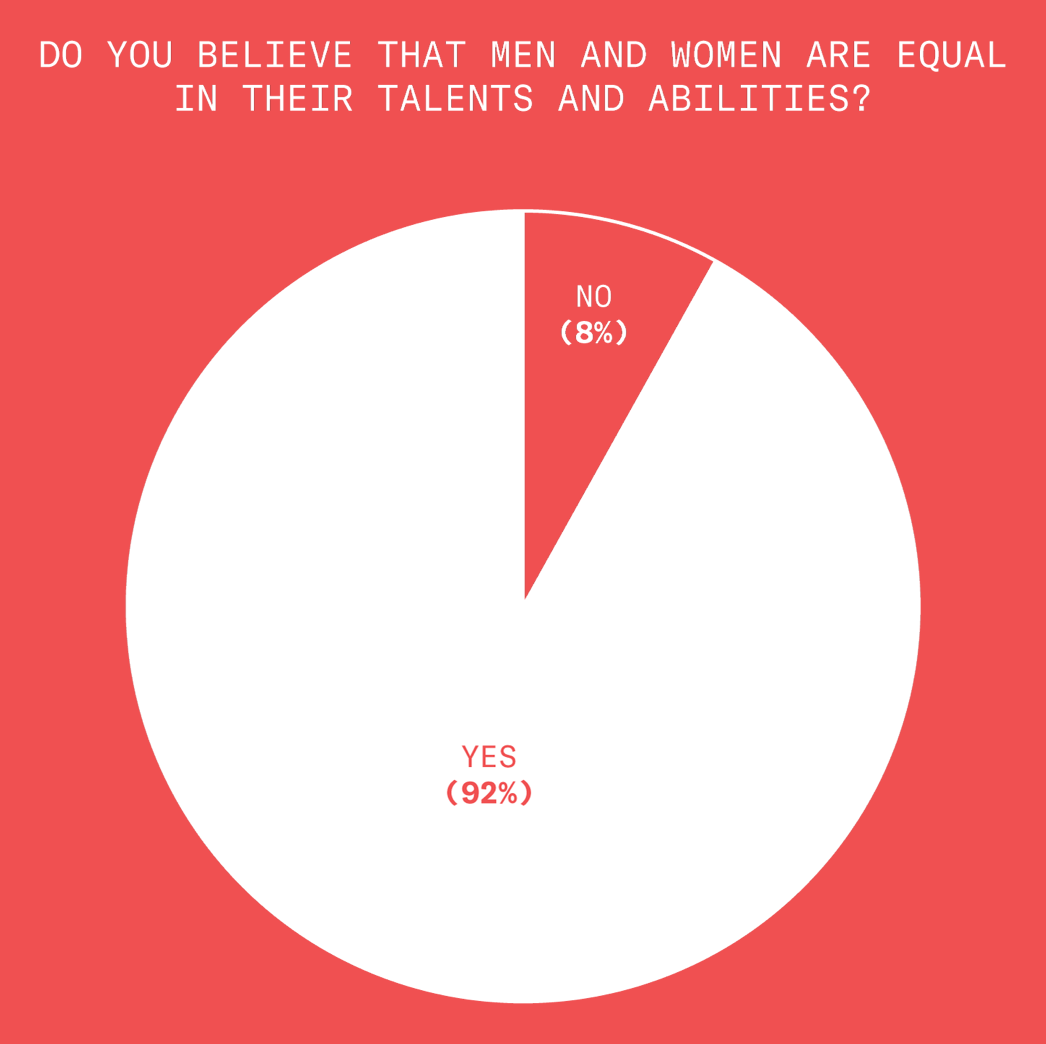
Ho boy, here we go.
Nearly all Democrats agree that men and women are equal in their talents and abilities.
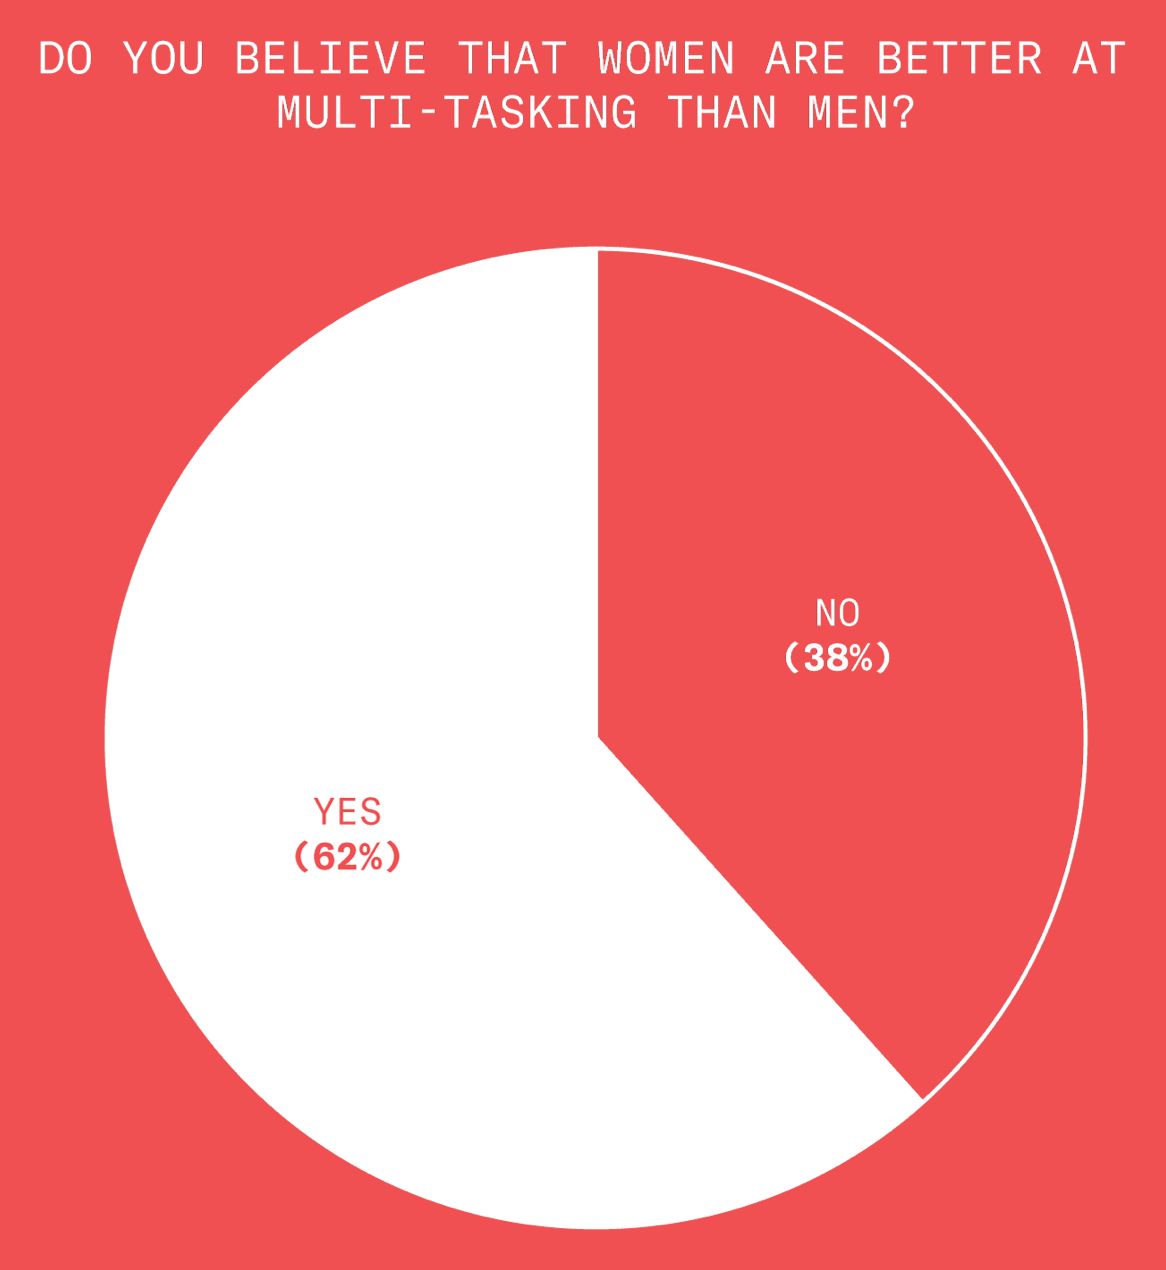
Gender Equality – 2 of 4
Except the ability to multitask. Women are better at that.
Gender Equality – 3 of 4
And the ability to feel empathy as a leader. Women are better at that too.
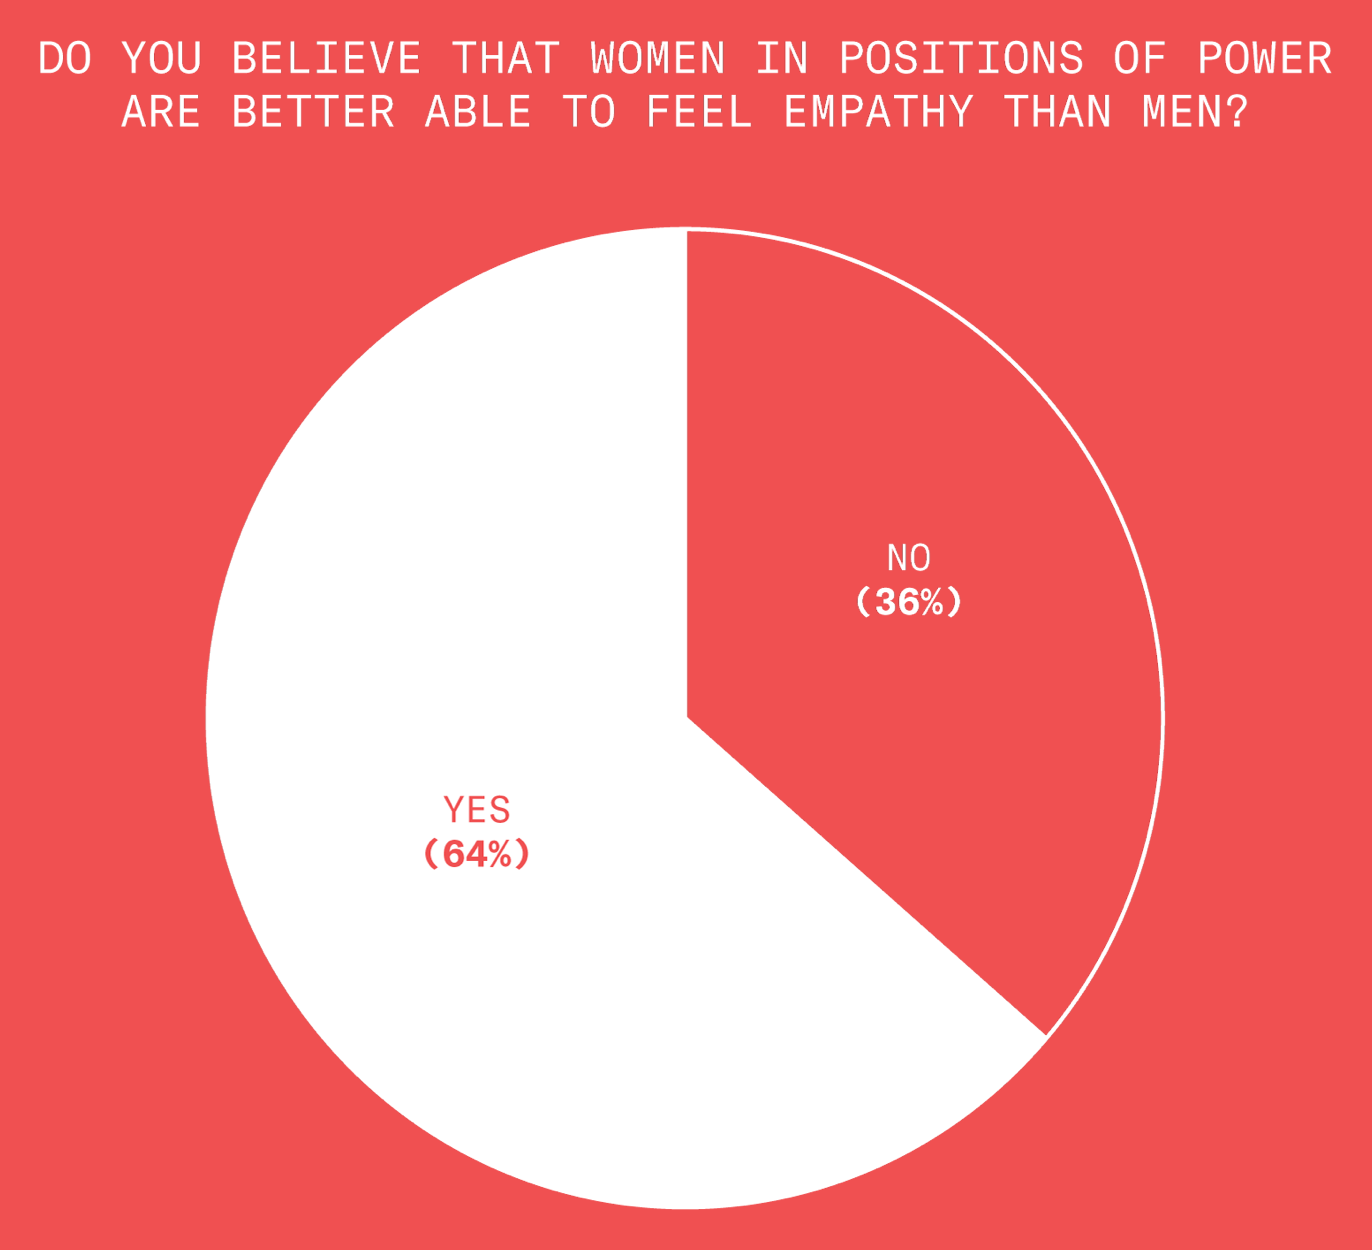
Gender Equality – 4 of 4
Yep, those are the same Democrats.
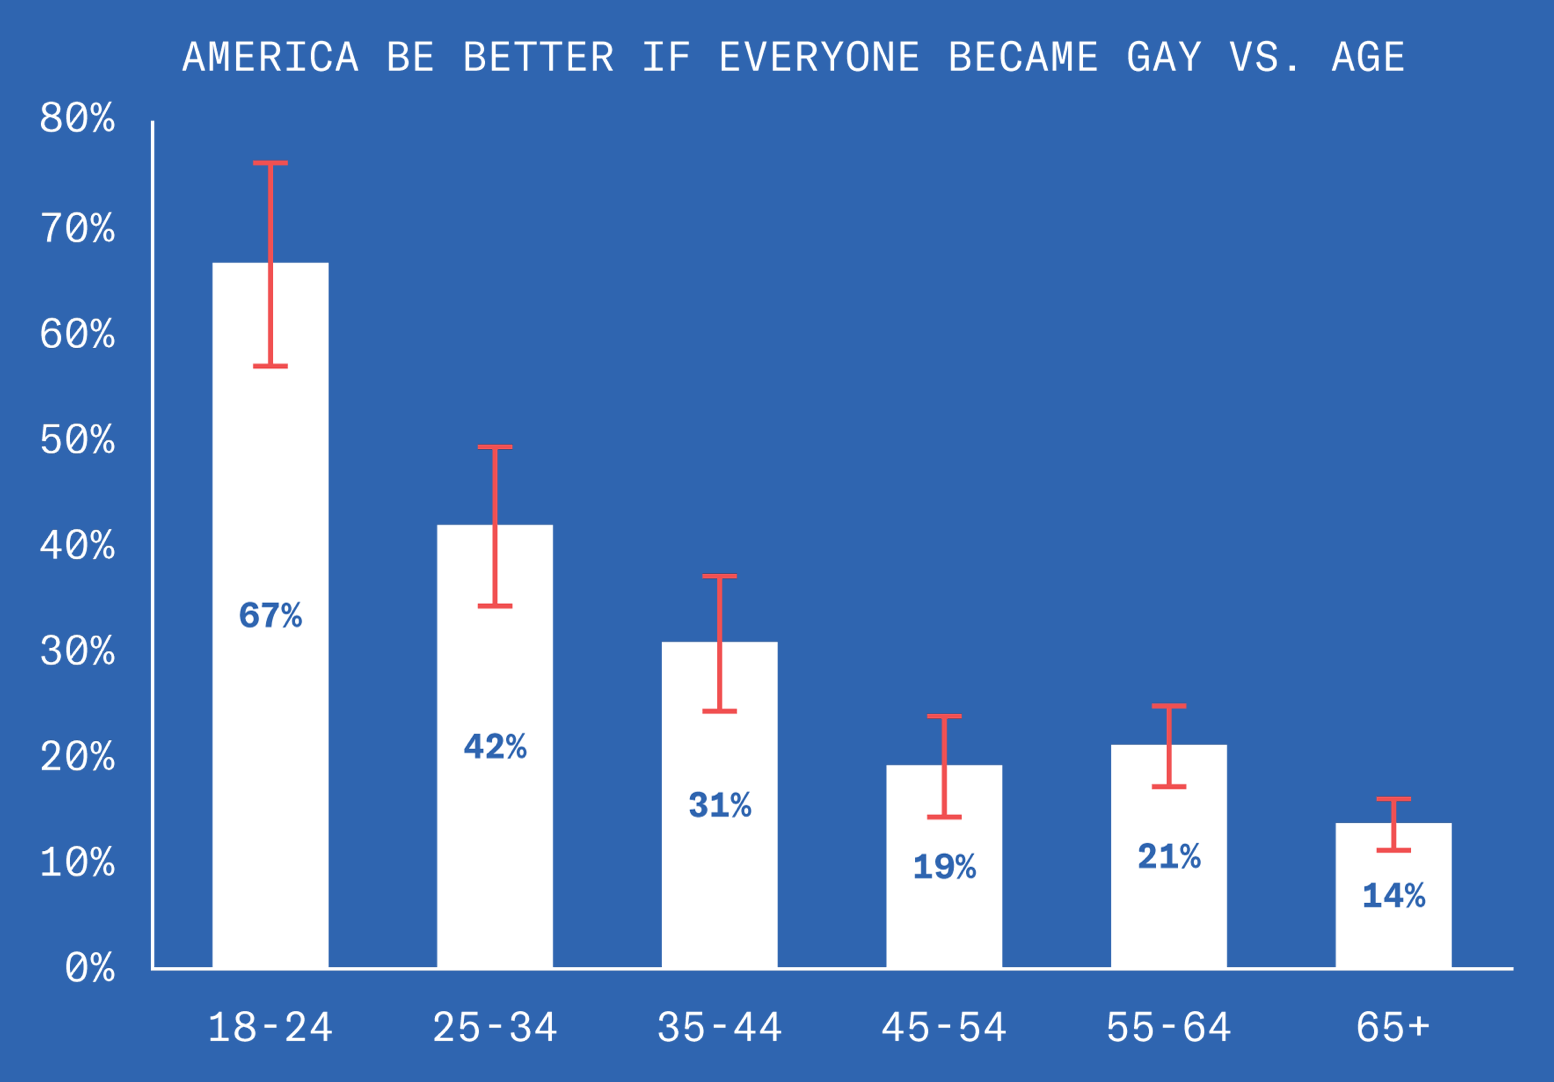
Gay America
Finally, we asked Democrats if America would be better or worse if everyone became gay.
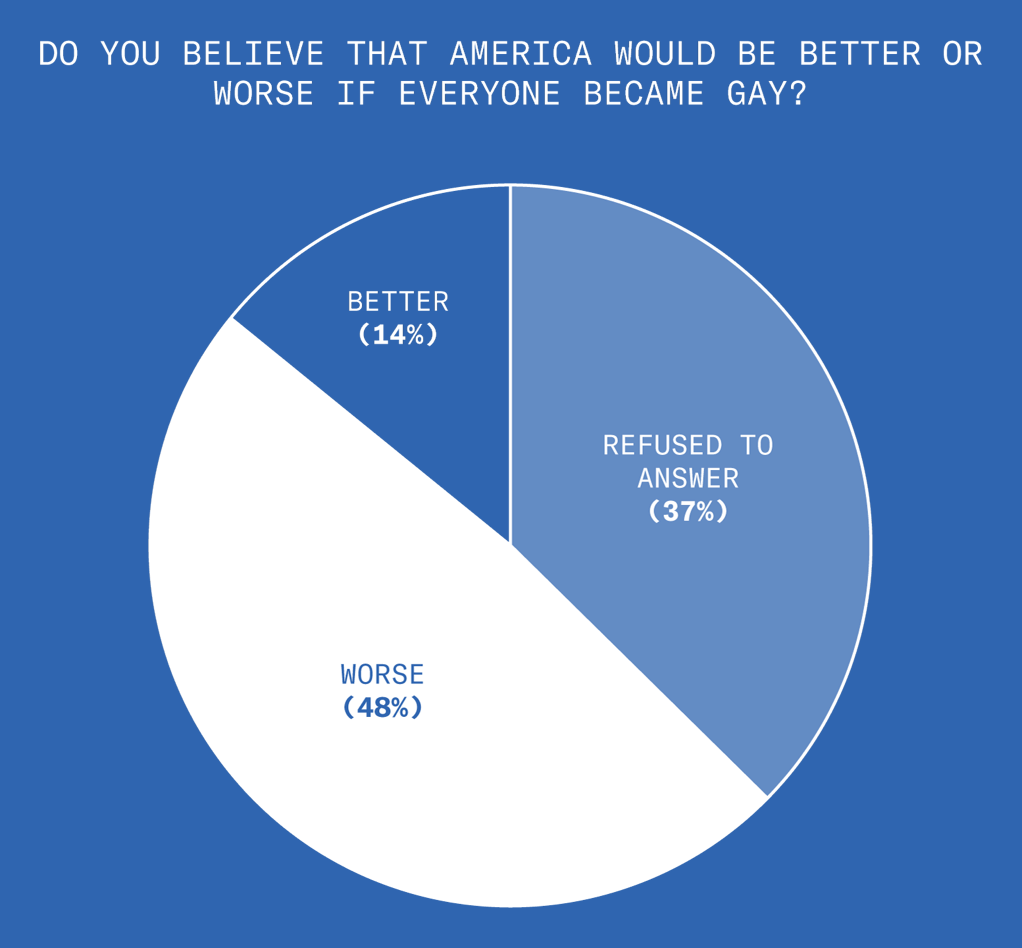
Gay America – 2 of 3
The more educated you are, the more likely you are to wisely refrain from answering this question.
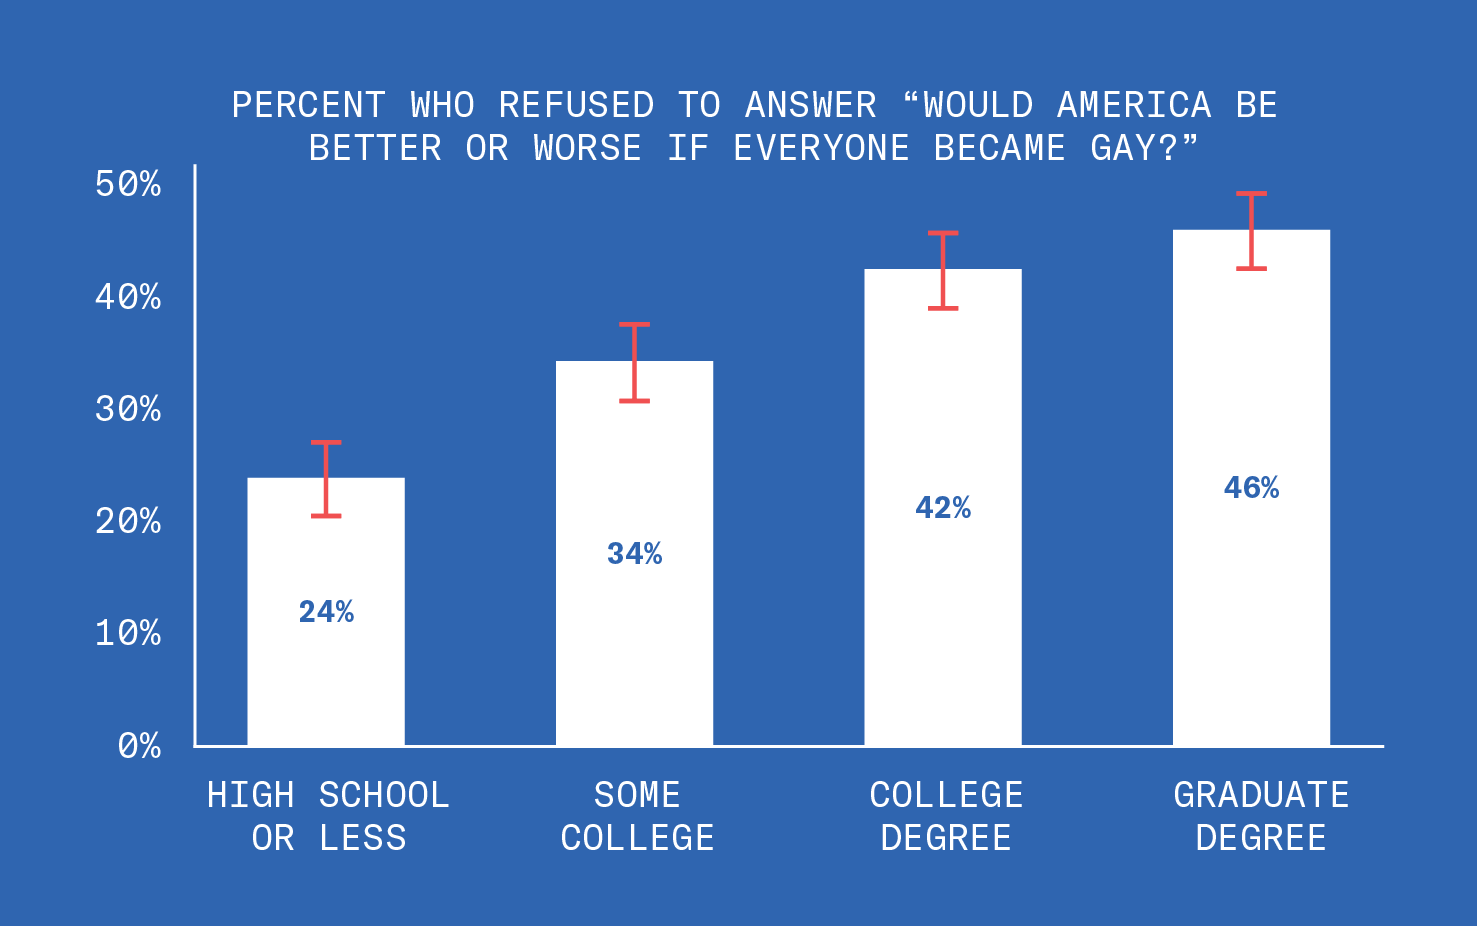
Gay America – 3 of 3
Oh no, conservatives’ worst fears are true! Millennial Democrats want to push a radical homosexual agenda on the American people!
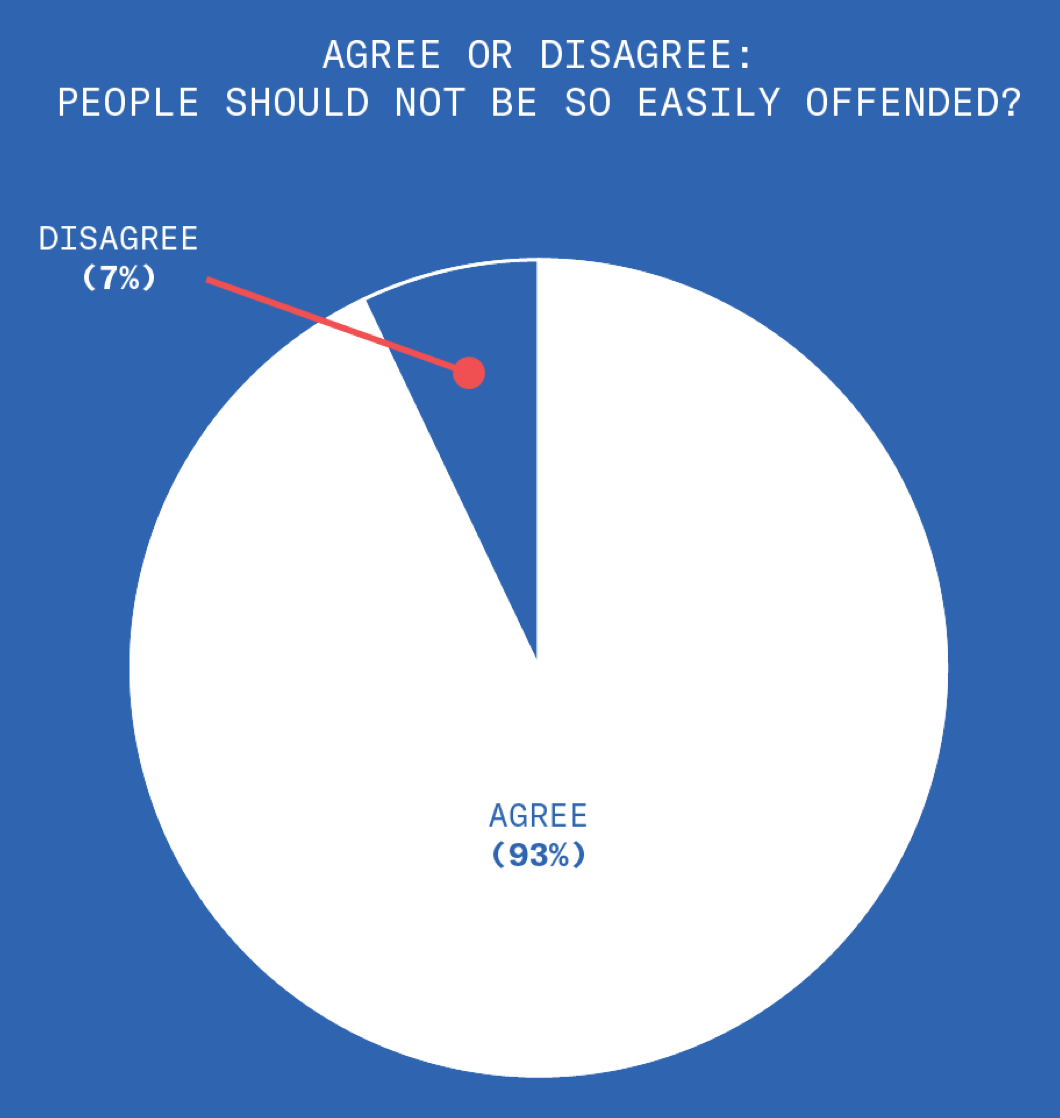
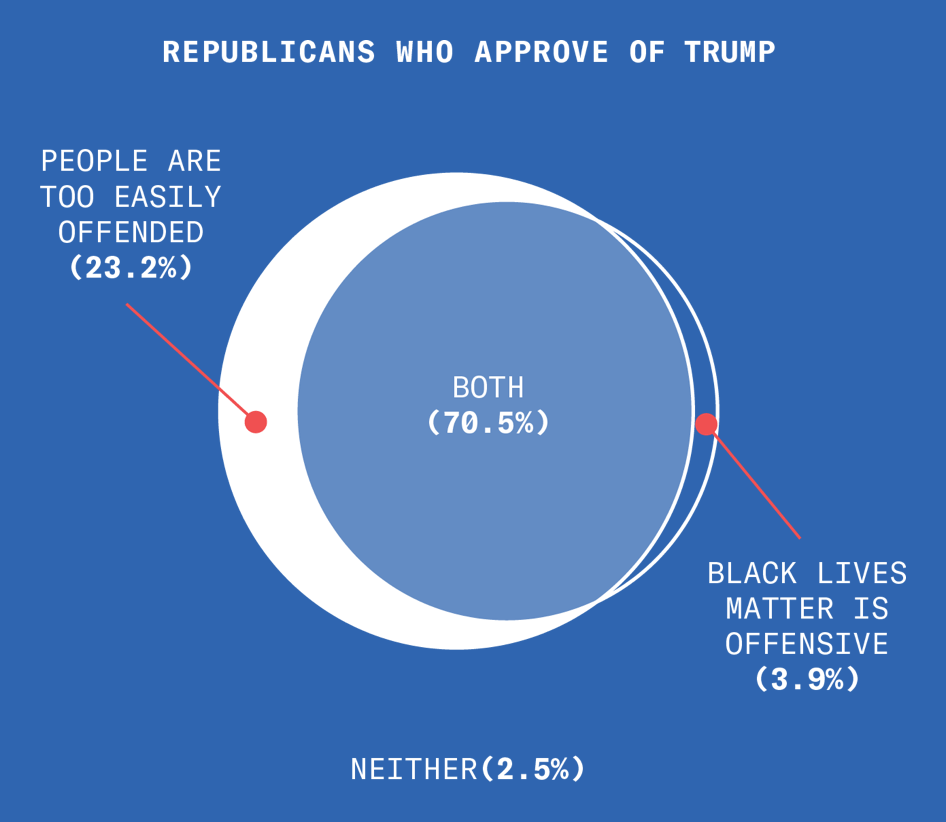
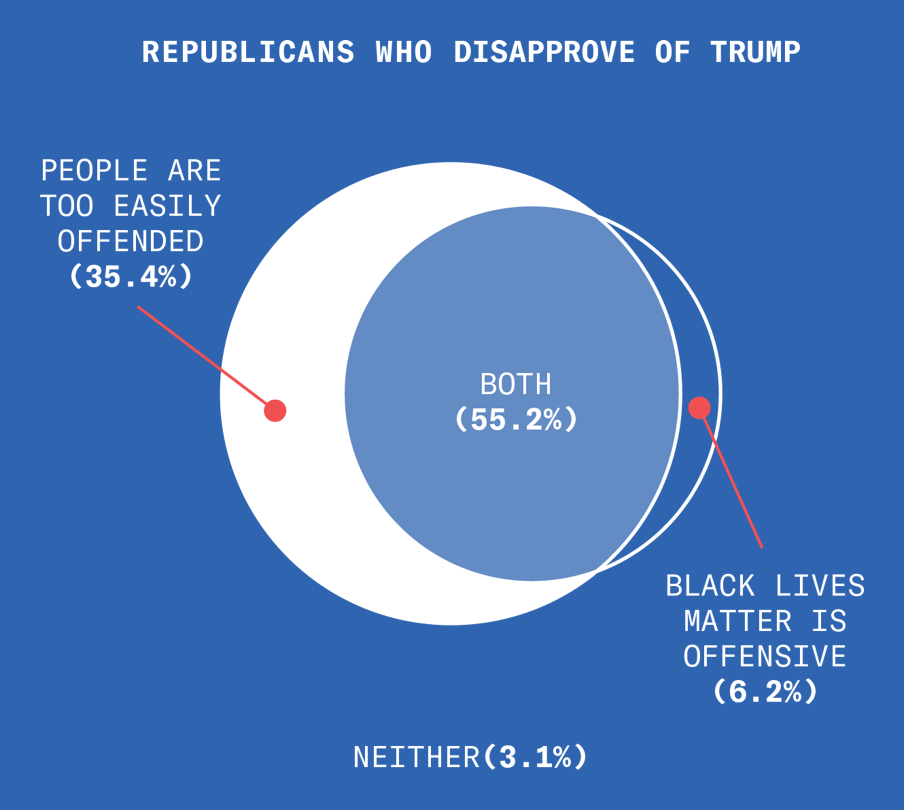
Getting all Offended
Republicans have had it up to here with everyone being a special snowflake. They’re nearly unanimous in their belief that “people should not be so easily offended.”
Getting all Offended – 2 of 4
Now let’s all take a sip of water and see what Republicans think about Black Lives Matter:
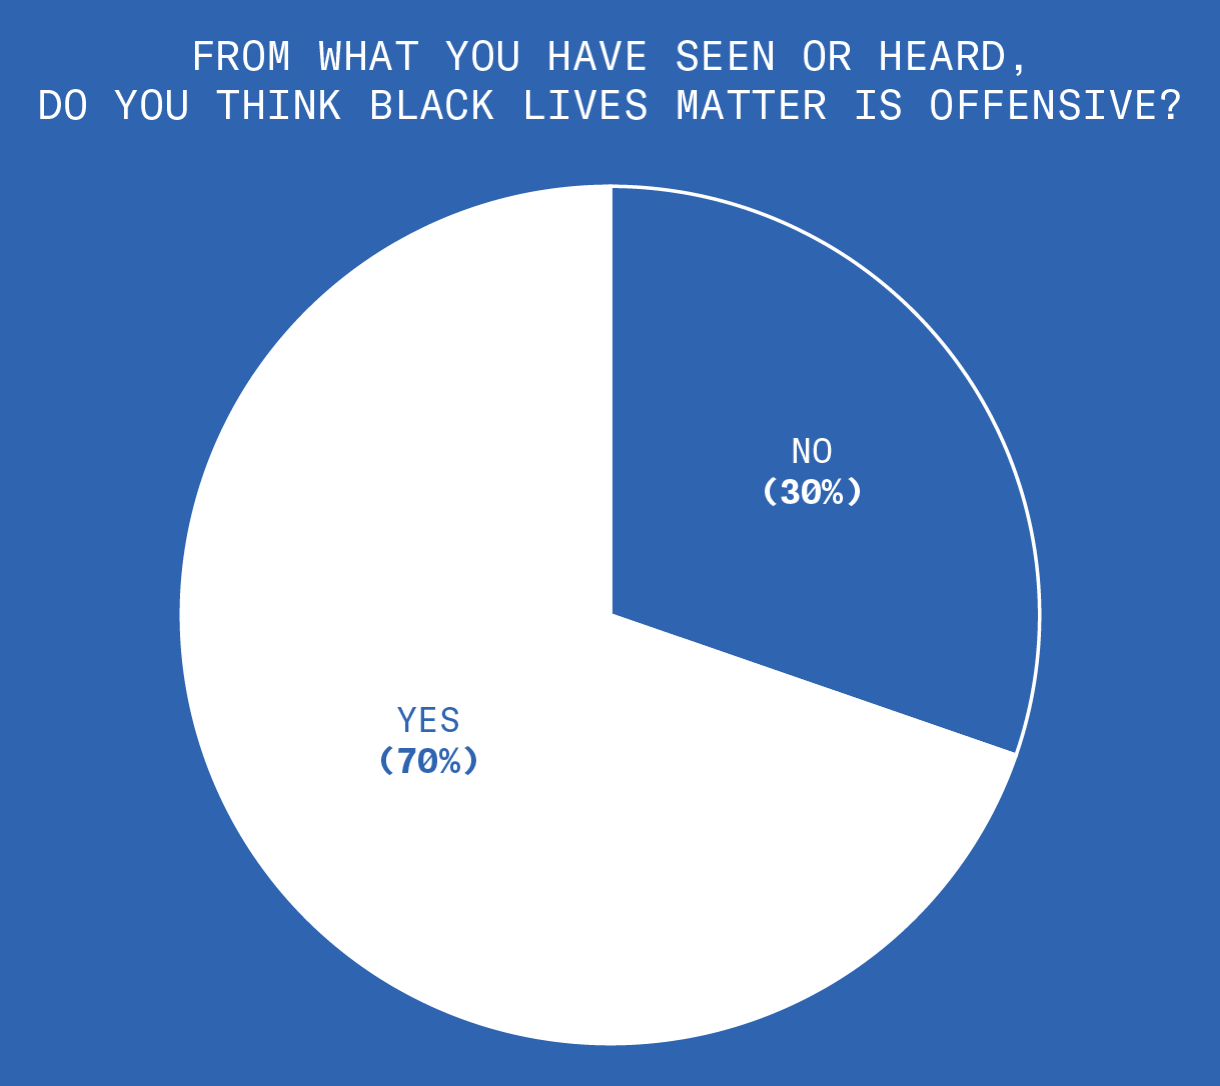
Getting all Offended – 3 of 4
The Republicans who are offended by Black Lives Matter are the same Republicans who think people shouldn’t be so easily offended.
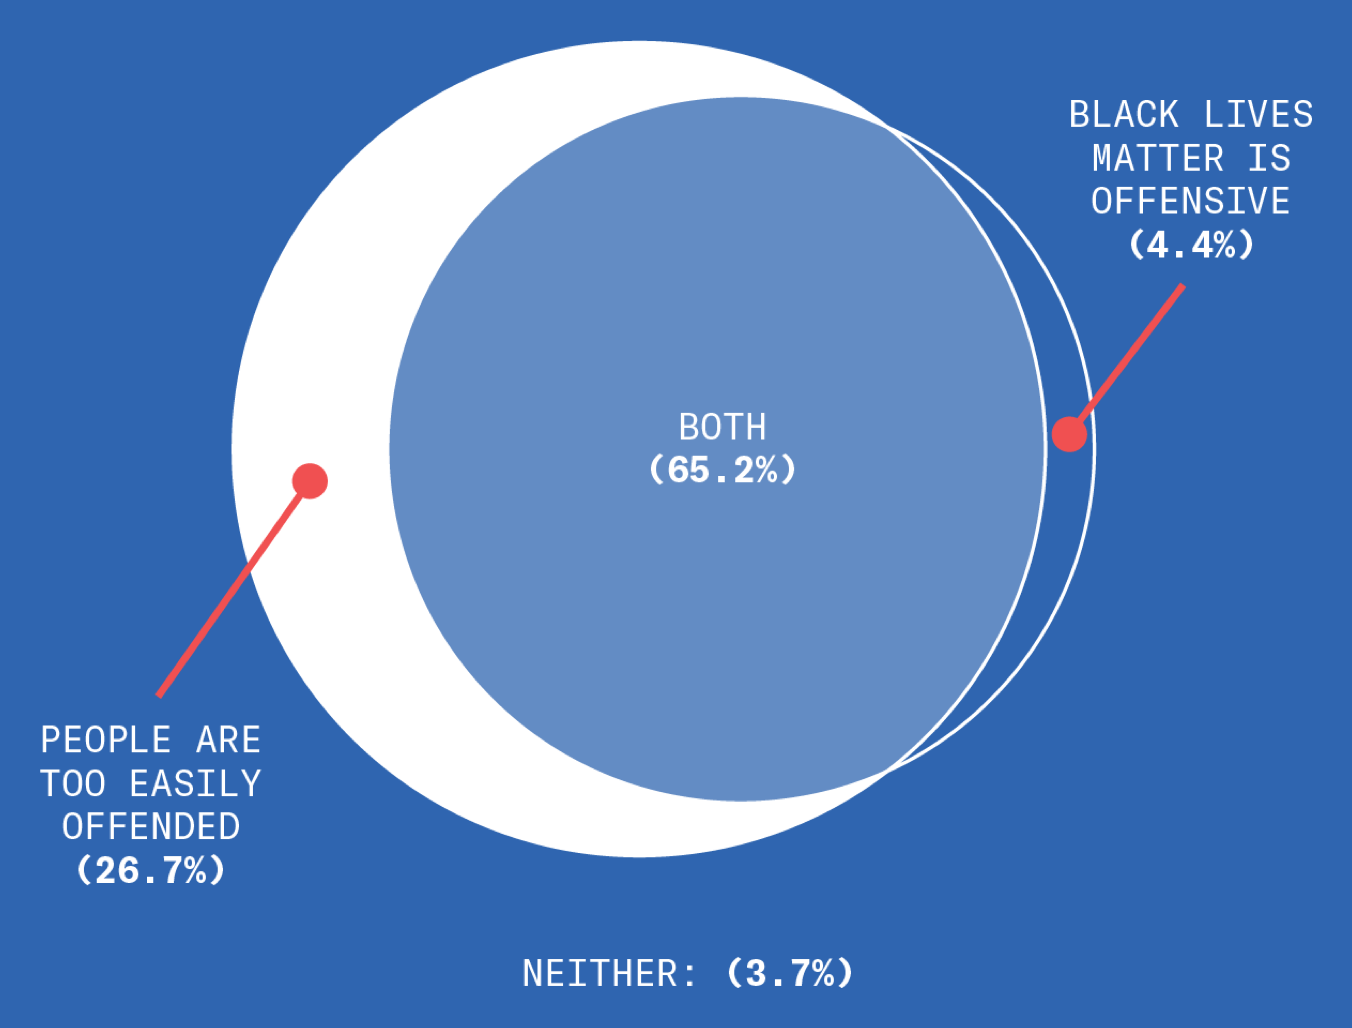
Getting all Offended – 4 of 4
Republicans who approve of Trump are more likely to suffer from this cognitive dissonance than Republicans who disapprove of Trump.
Free Speech
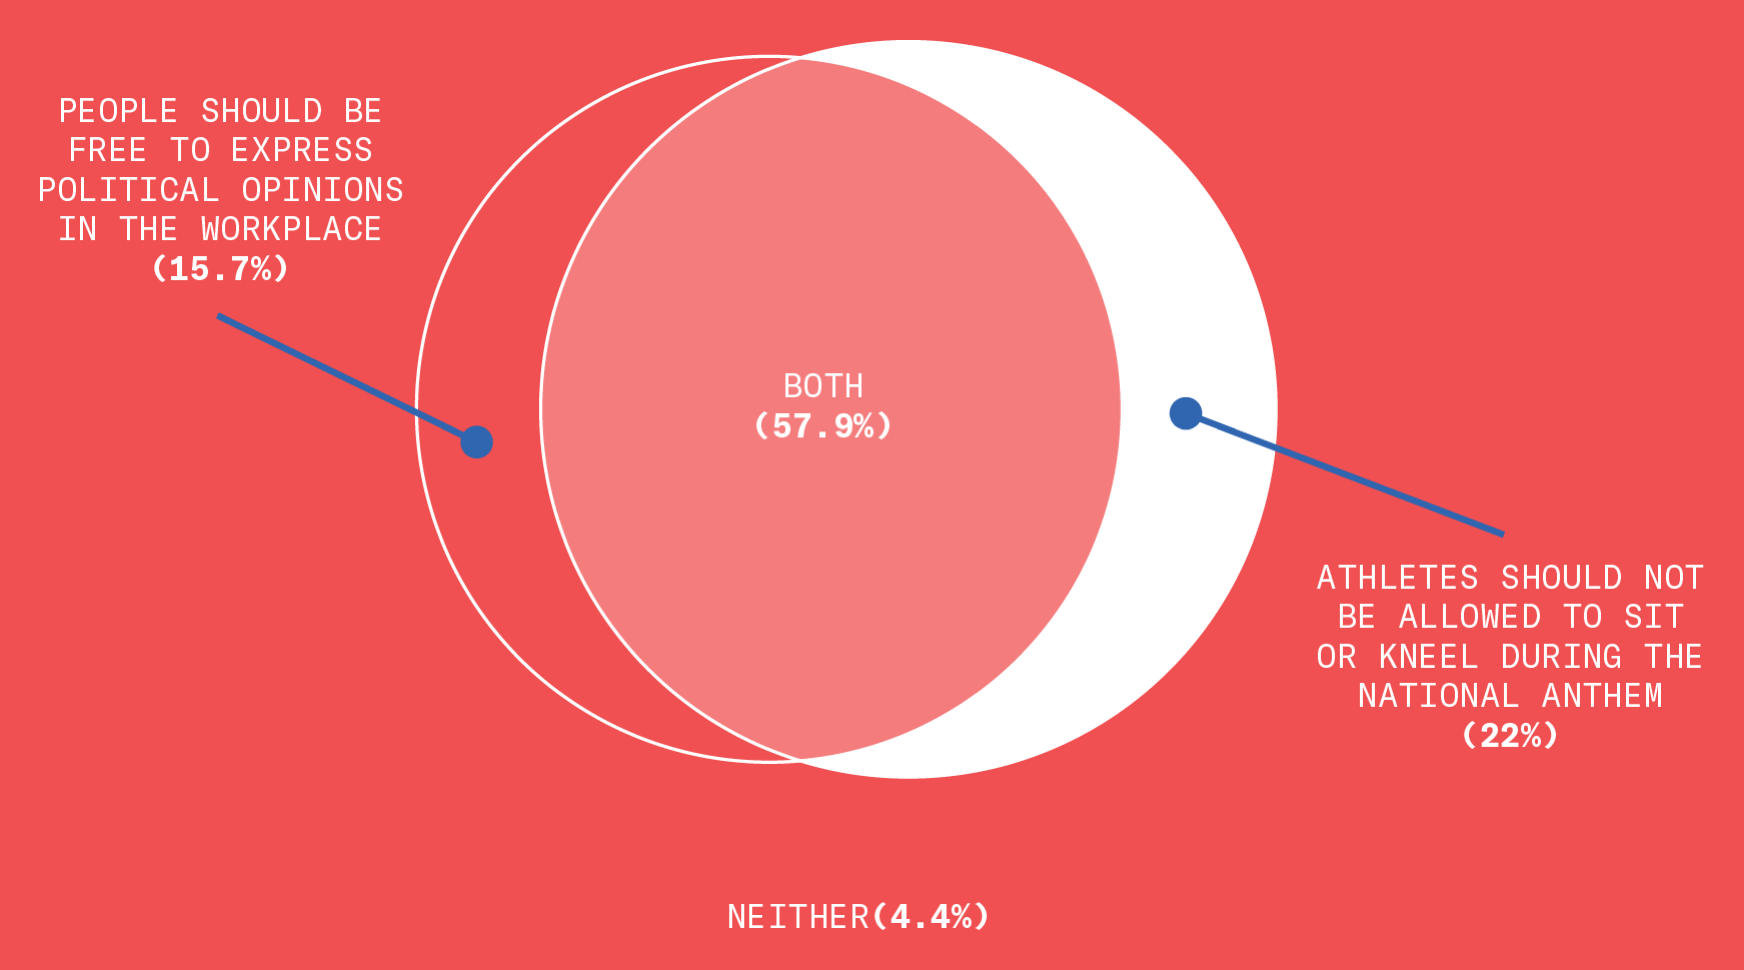
Republicans consider themselves to be staunch defenders of free speech. Most of them think you should be allowed to express a political opinion in the workplace without getting fired.
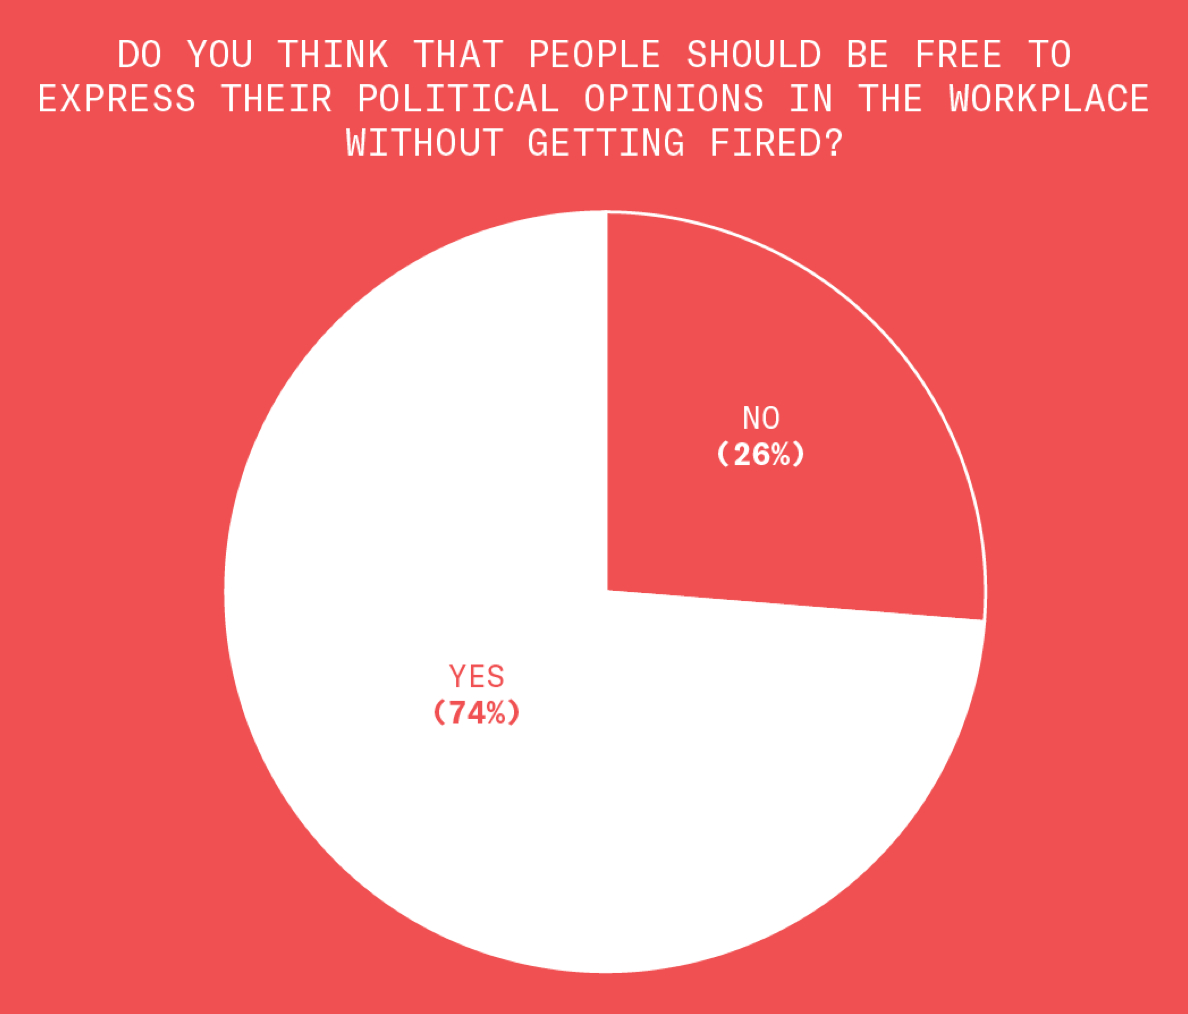
Free Speech – 2 of 4
However, if your workplace is a sports stadium, and your job is “athlete,” you better shut the fuck up about politics and respect the flag!
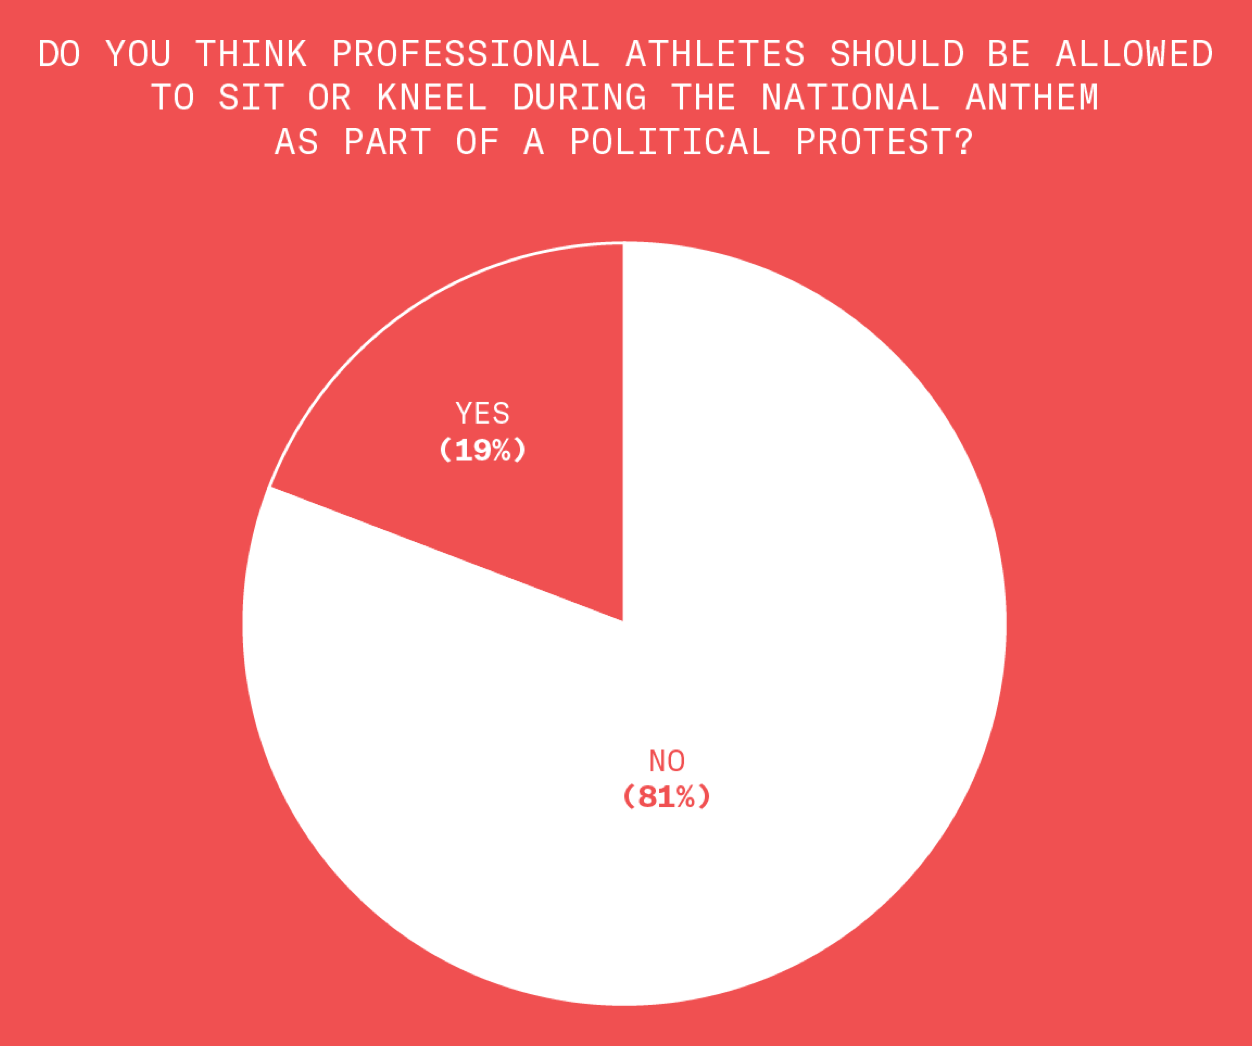
Free Speech – 3 of 4
These are obviously irreconcilable political positions. And yet here we are.
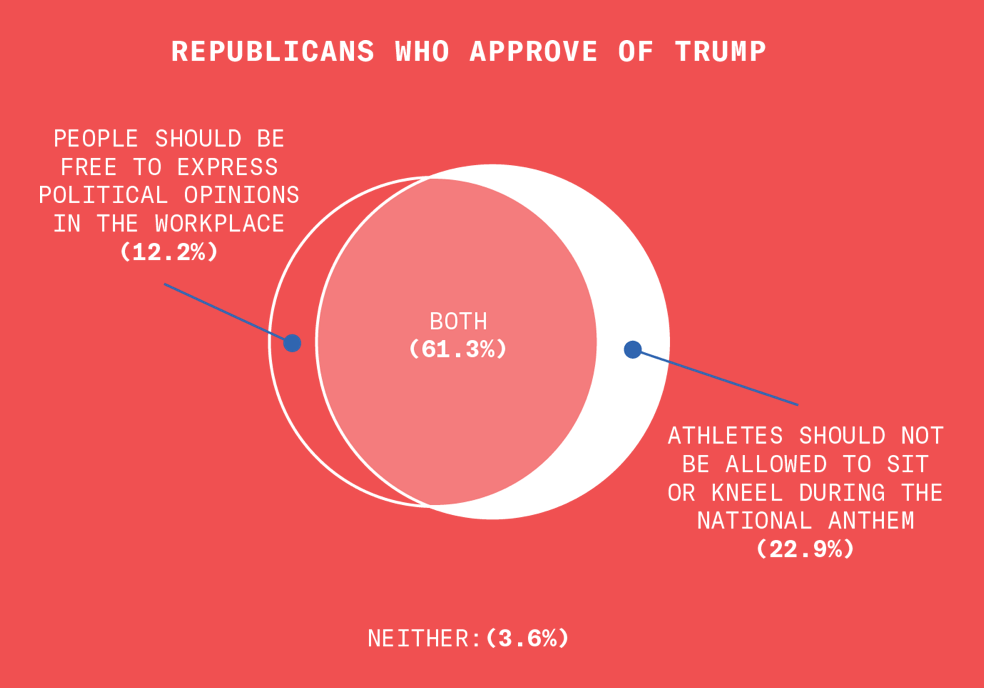
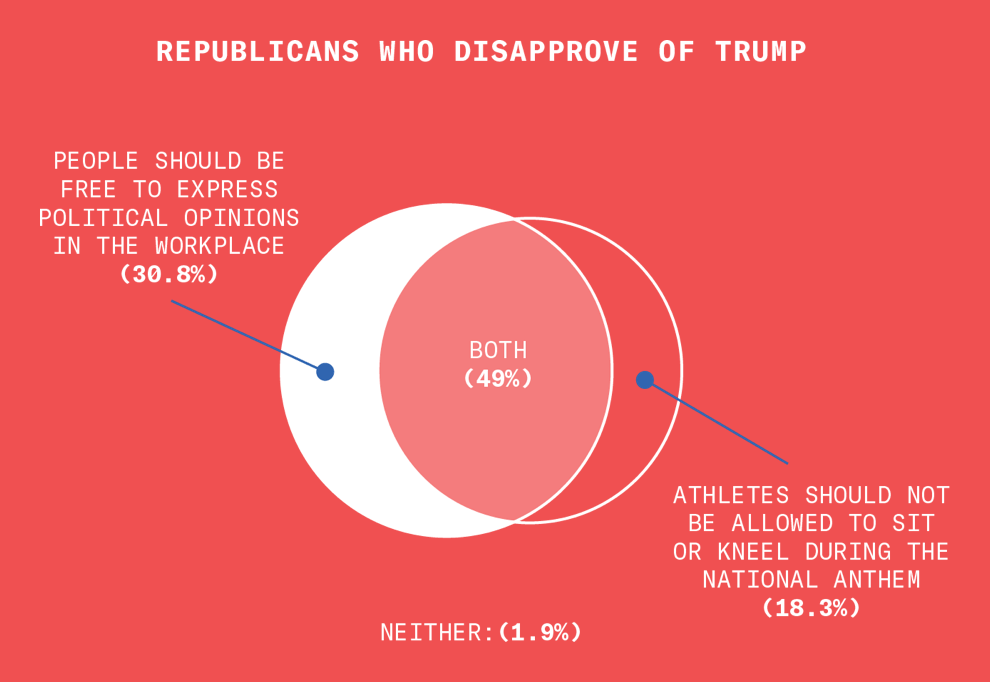
Free Speech – 4 of 4
Once again, Trump-supporting Republicans are more “ideologically” “flexible” than Republicans who disapprove of Trump.
Foreigners
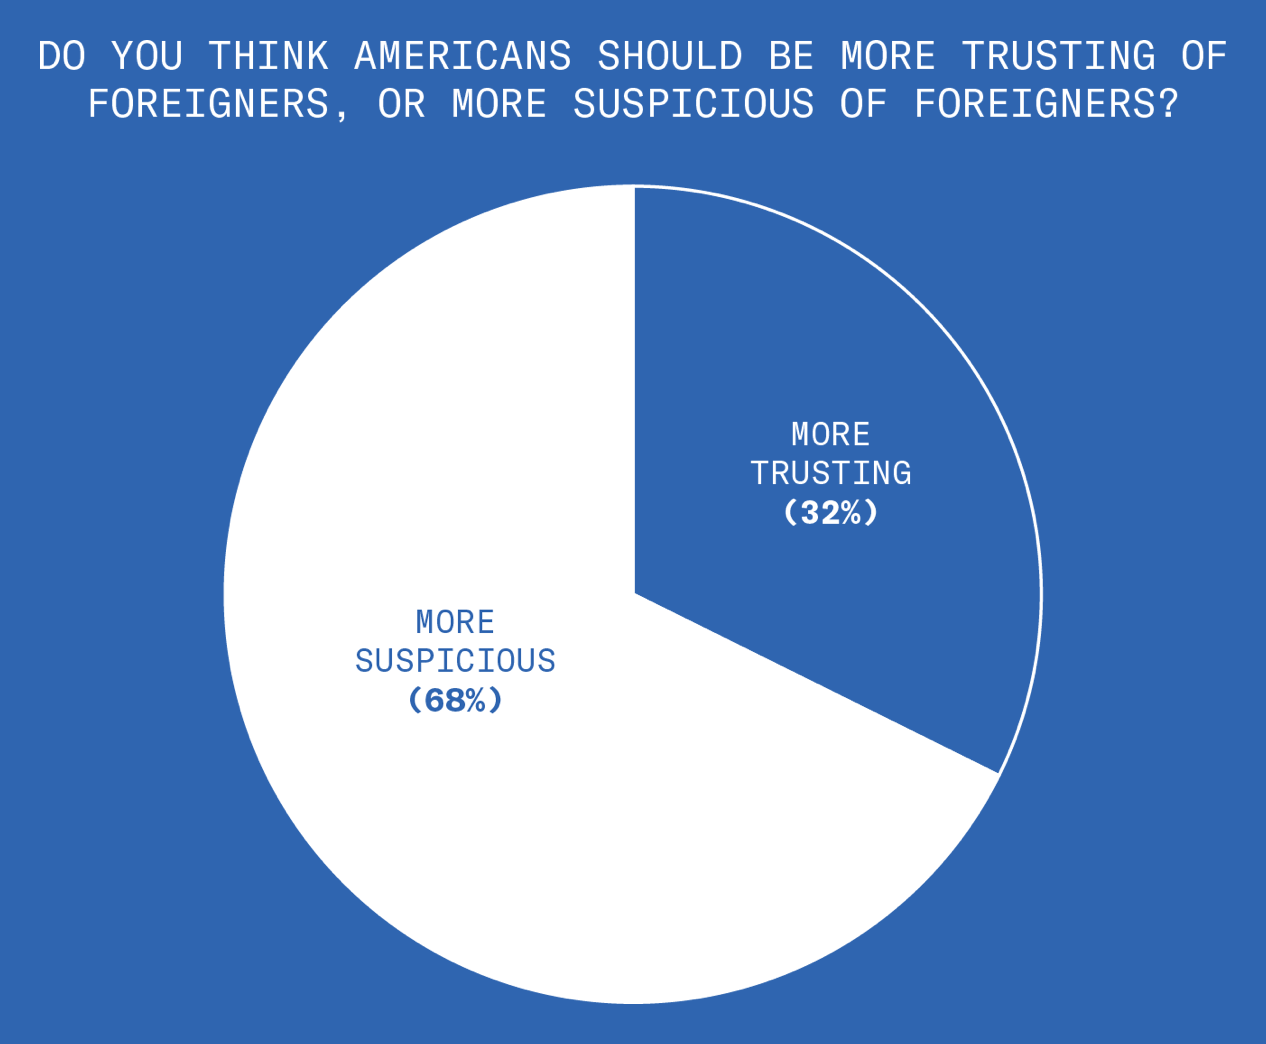
Most Republicans think we should be more suspicious—as opposed to more trusting—of foreigners.
Foreigners – 2 of 4
This makes sense. We should be suspicious of foreigners who are openly hostile to American interests, like Vladimir Putin. Oh, wait.
Foreigners – 3 of 4
One in three Republicans manage to distrust foreigners while trusting Vladimir Putin.
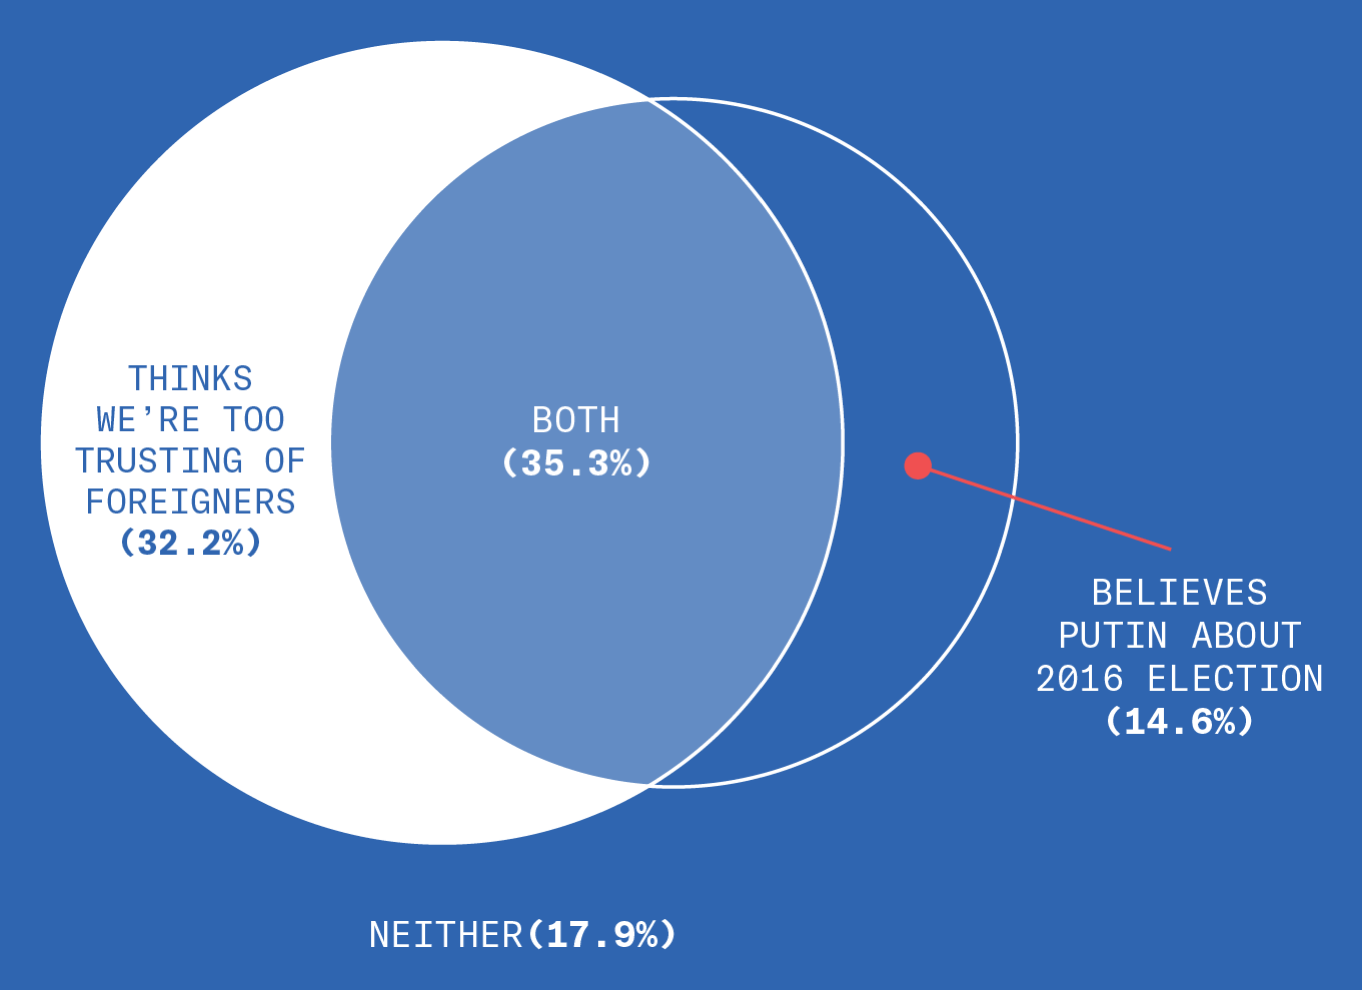
Foreigners – 4 of 4
Republicans who approve of Trump are over twice as likely to pull off this feat of mental gymnastics than Republicans who disapprove of Trump.
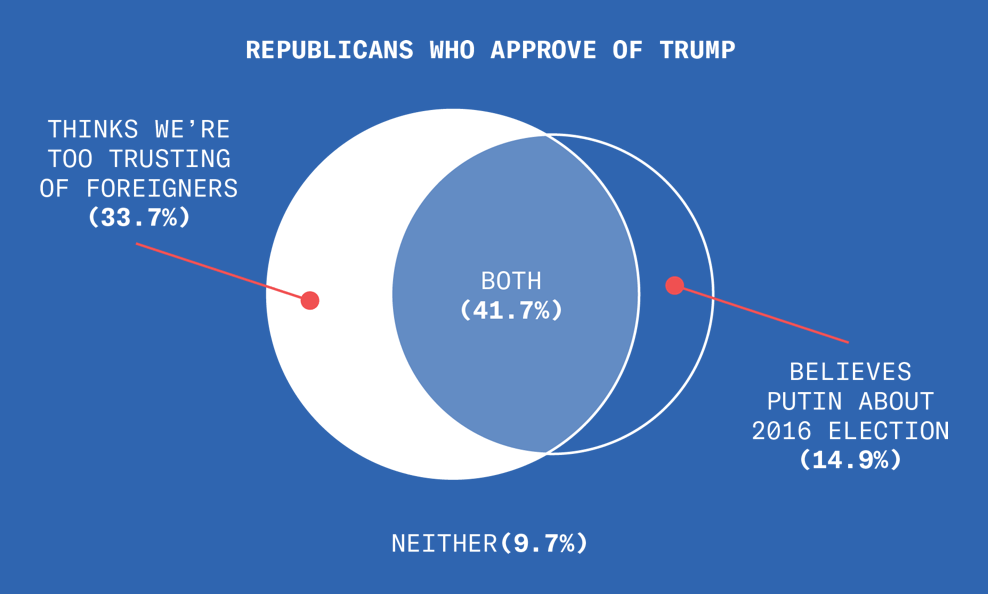
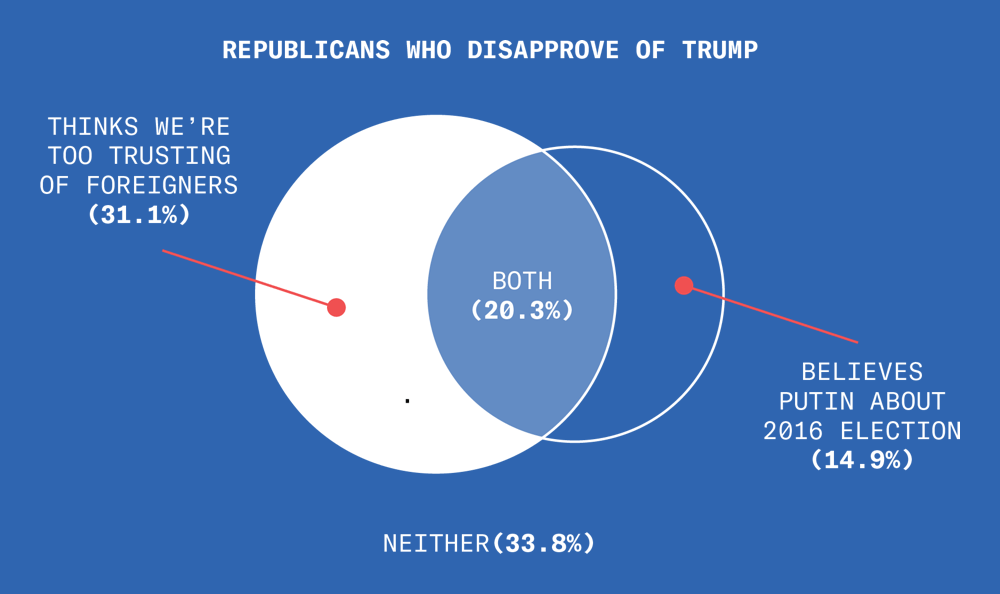
OK, we’re getting to the point where exposing hypocrisy is no longer funny and just kind of sad.
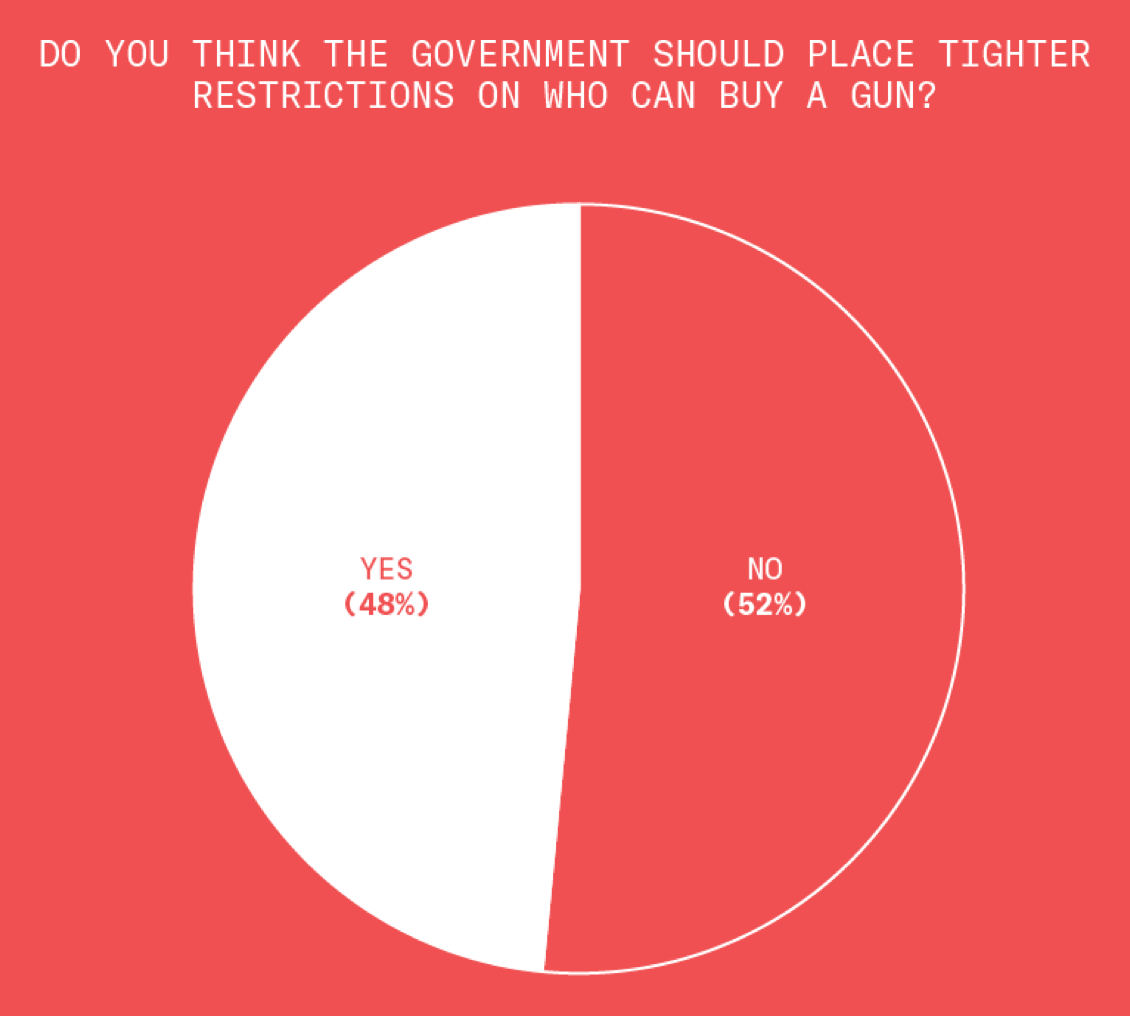
Big Government
We asked Republicans if they thought the government should place tighter restrictions on who can buy a gun. They were evenly split on the question.
Big Government – 2 of 2
We asked Republicans if they thought the government should place tighter restrictions on access to pornography. Most said yes.
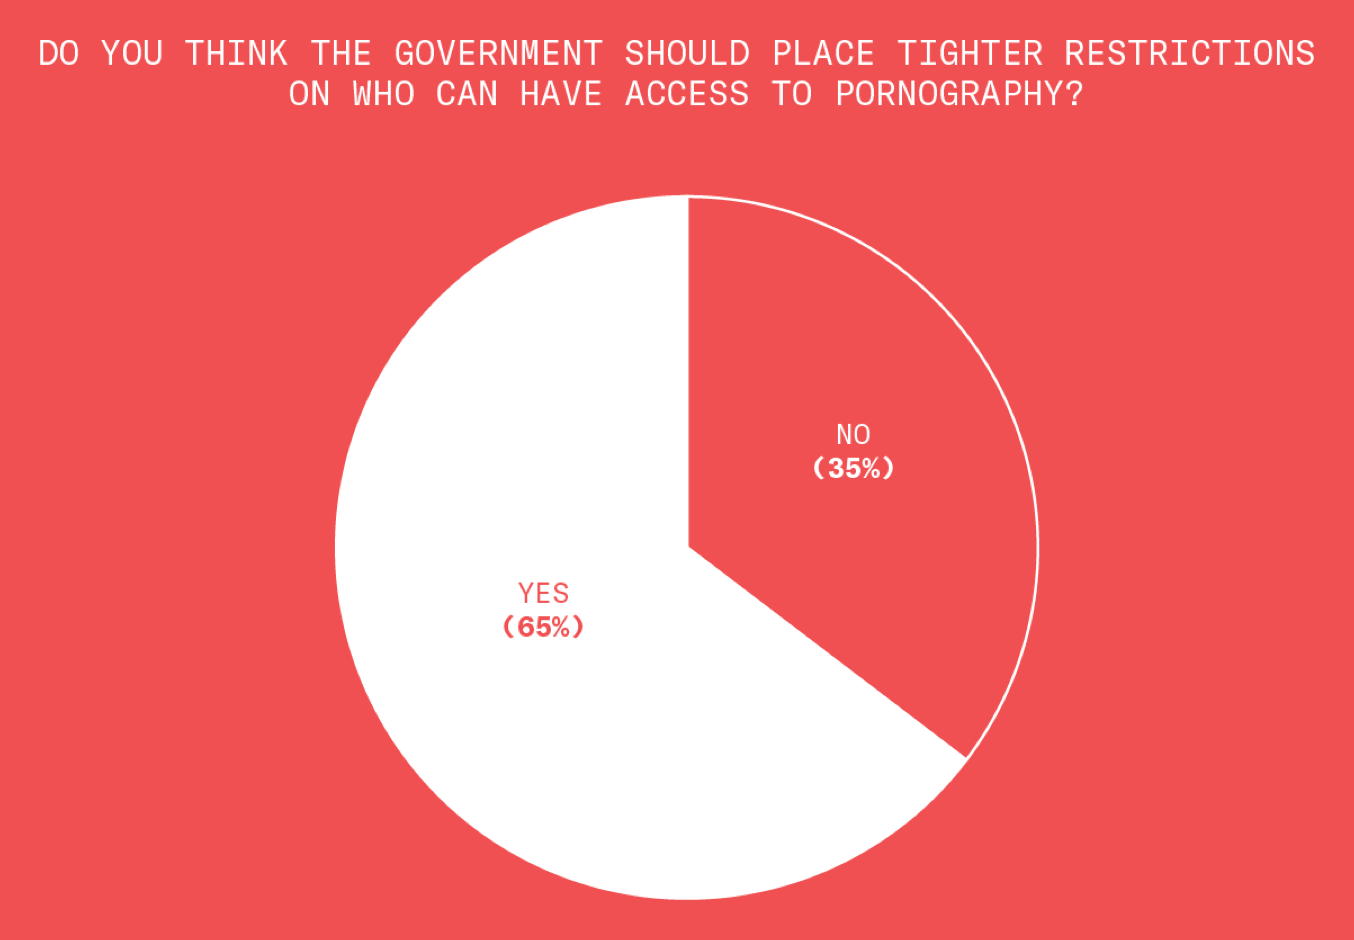
At least they have their priorities straight.
Jesus Christ
If Jesus were alive today, would he support Donald Trump? For some reason, a lot of Republicans refused to answer this question. We hypothesize that their heads exploded.
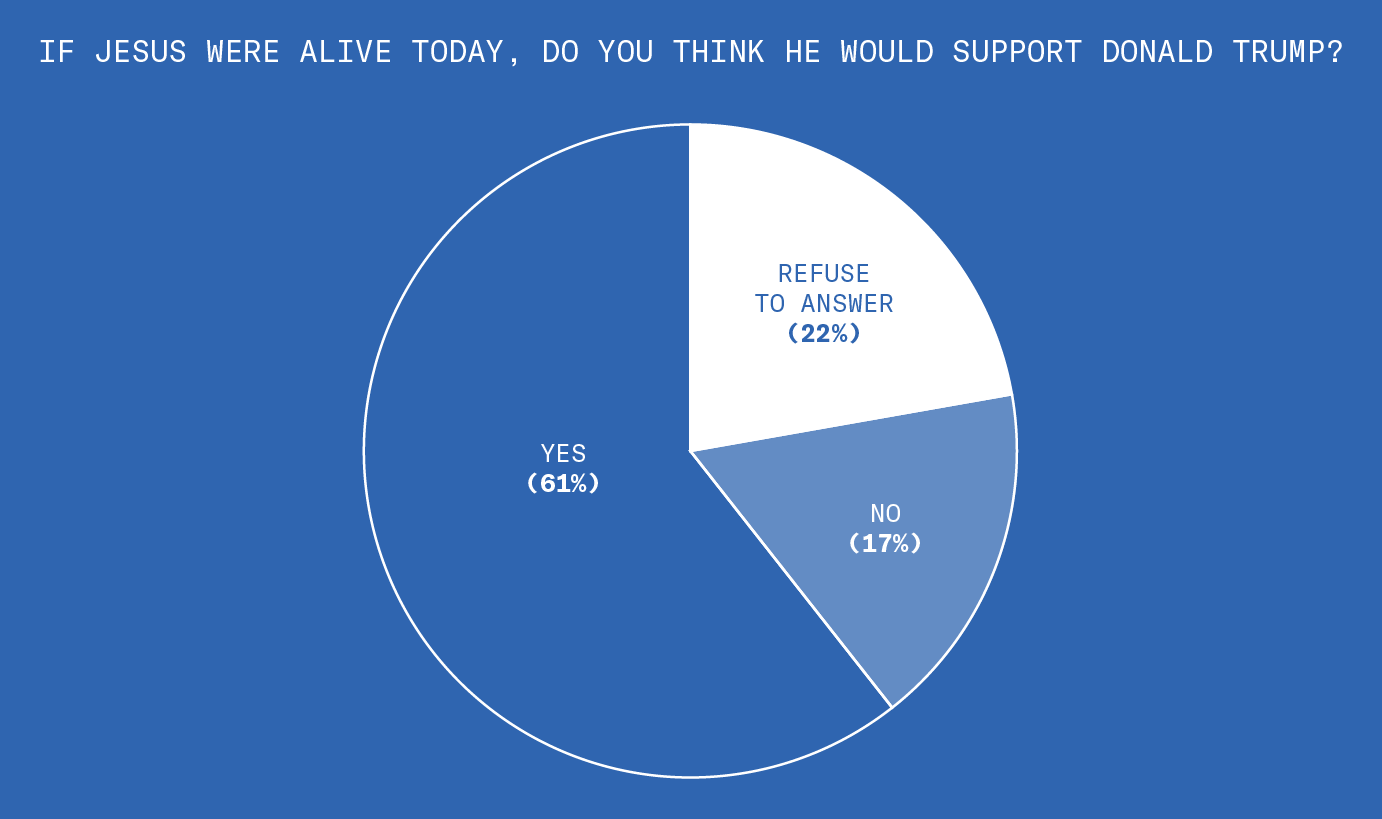
Yes, gentle Trump, mild and meek, who feeds the poor and heals the sick, who loves his neighbor and blesses those who persecute him, who never looketh upon a woman with lust, and who did not come to be served, but to serve, and to give his life a ransom for many.
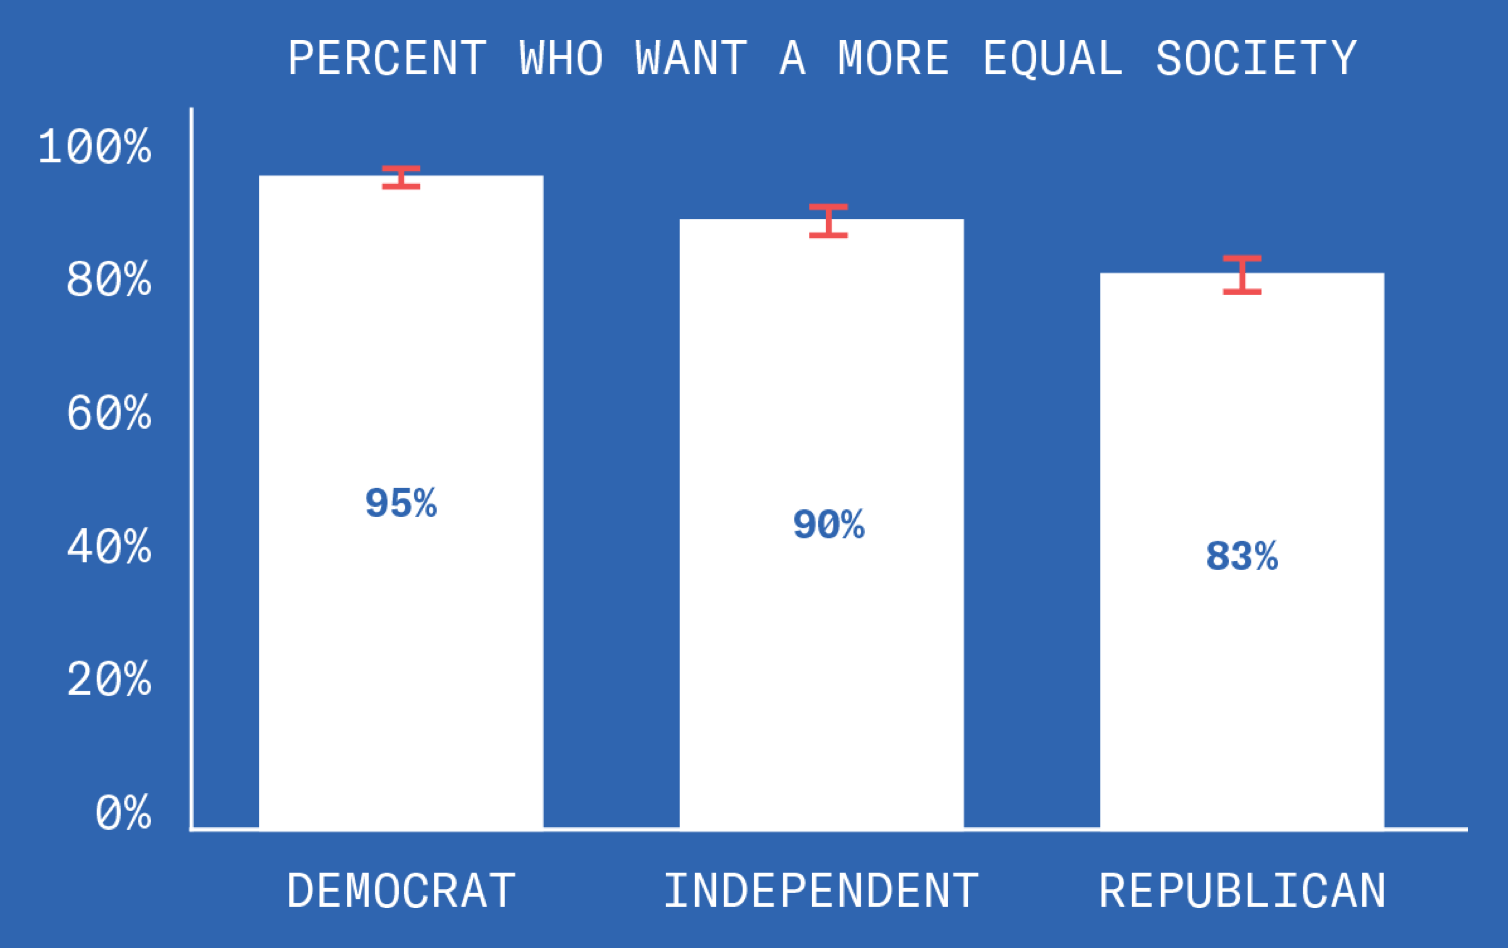
Equality
We asked people if they’d rather live in a more equal society or a more unequal society. Almost everyone said they’d rather live in a more equal society.
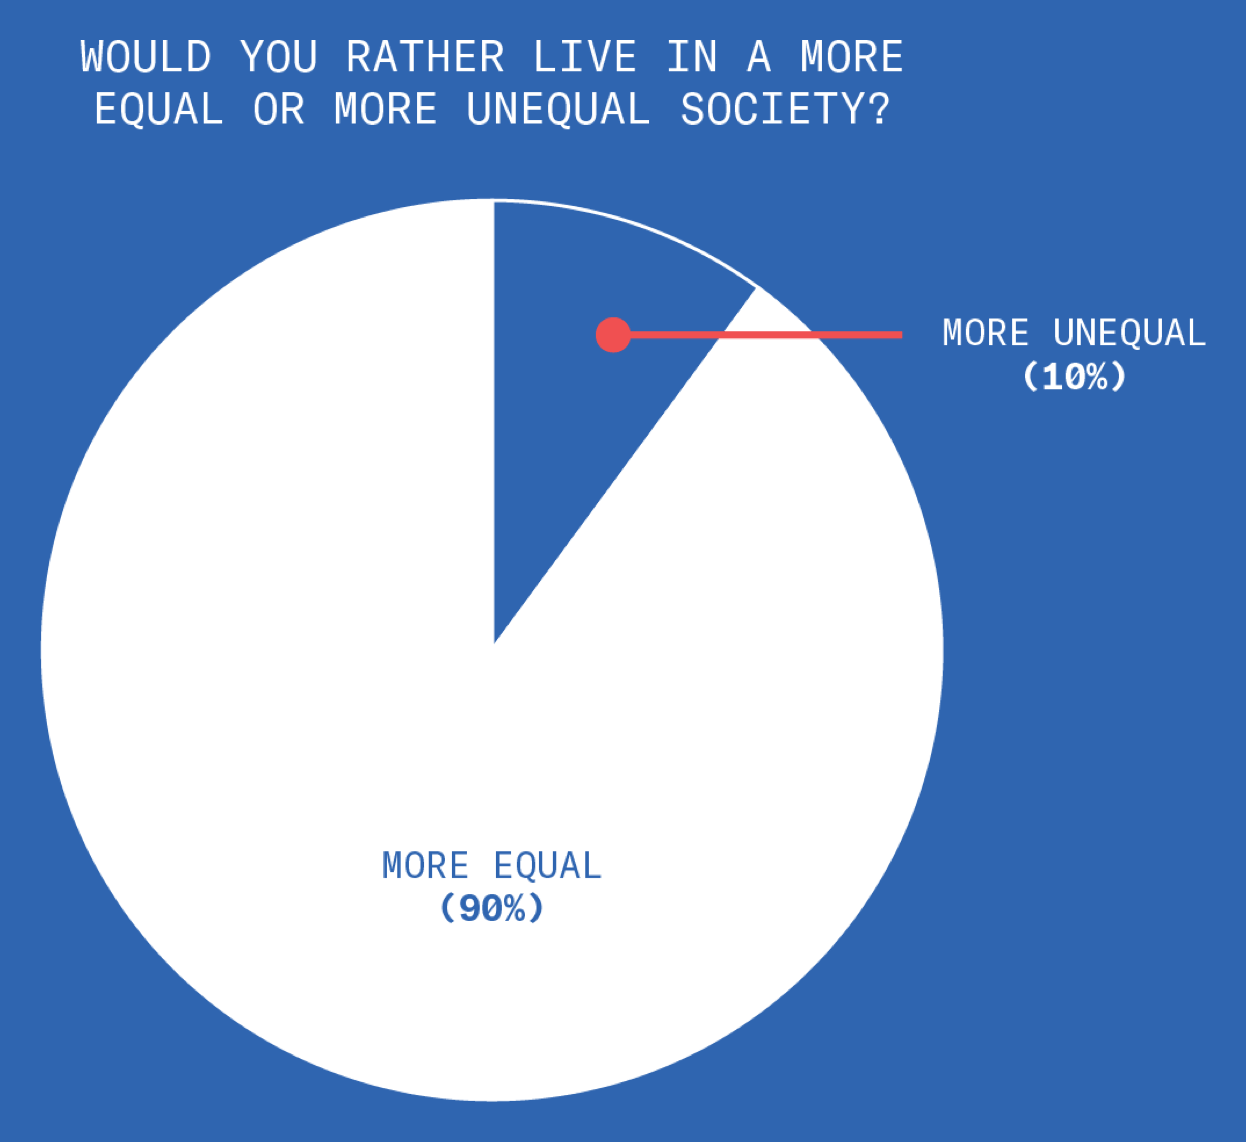
Equality – 2 of 3
Look! Even Republicans want to live in a more equal society.
Equality – 3 of 3
But when we asked people about actually creating a more equal society through redistribution of wealth... womp womp! Democrats were nearly four times as likely as Republicans to say that the government should redistribute wealth.
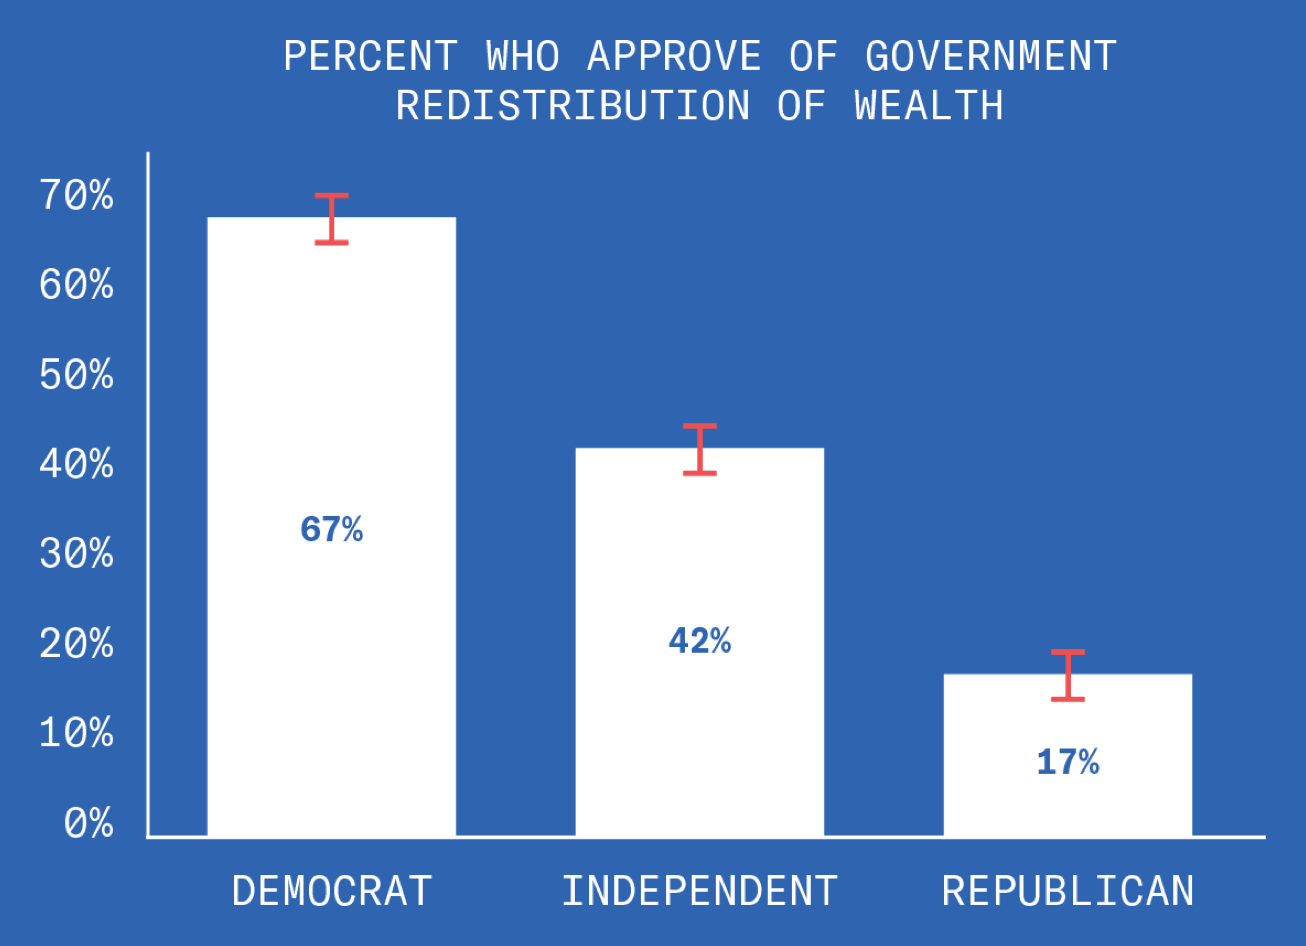
So Republicans want a more equal society, but only if it happens by magic.
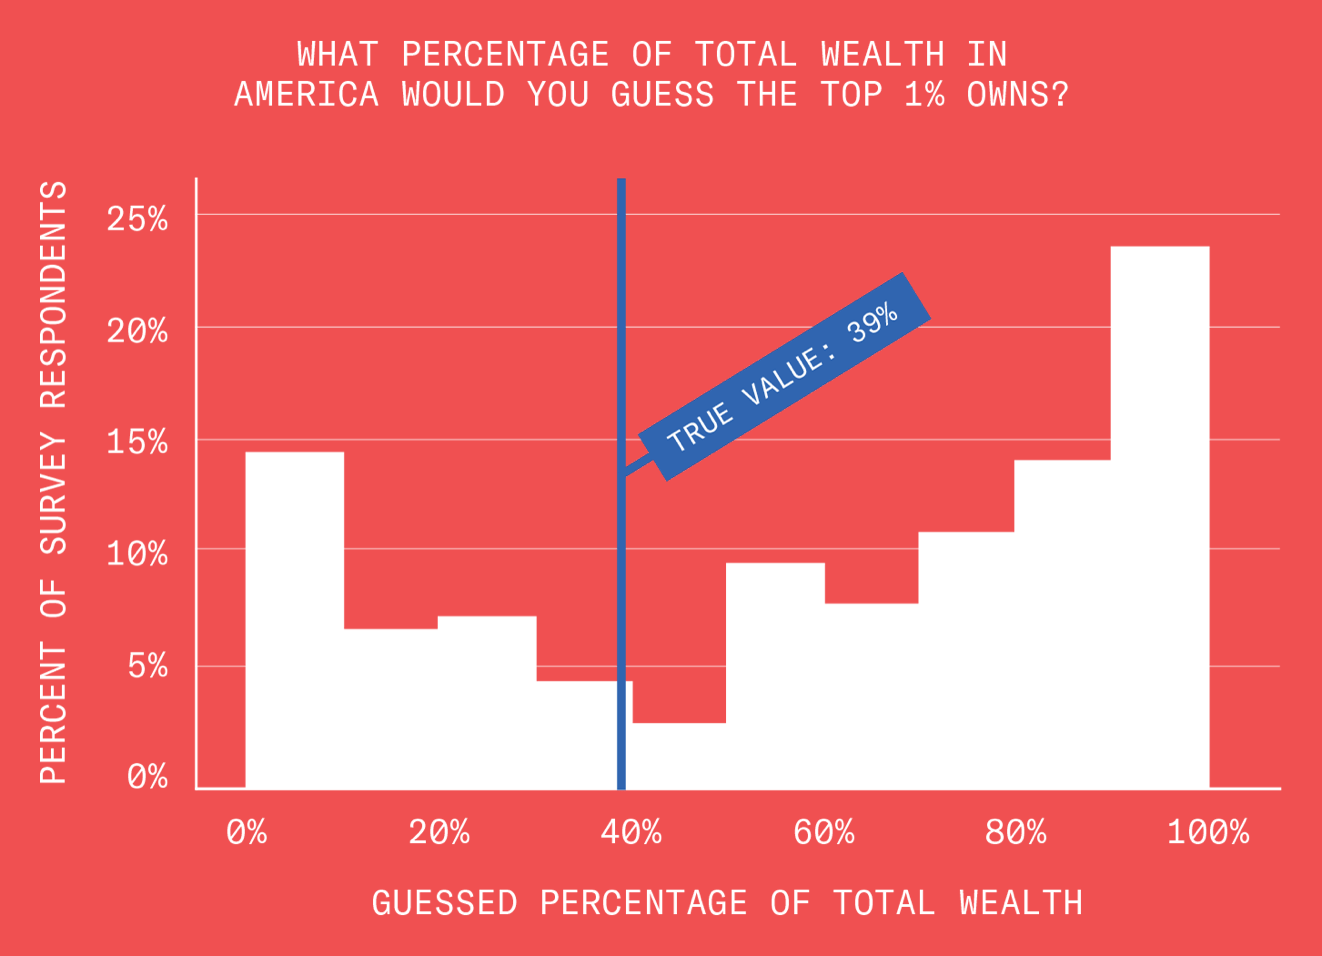
Estimating Equality
We asked people to guess how much of the country’s wealth was owned by the richest 1% of Americans. The answer is 39%, which is insane, but liberals have done such a great job panicking about inequality that most people think it’s worse.
Estimating Equality – 2 of 3
As usual, Democrats are a few years ahead of the curve. Maybe they were factoring in the effects of the Republican tax plan.
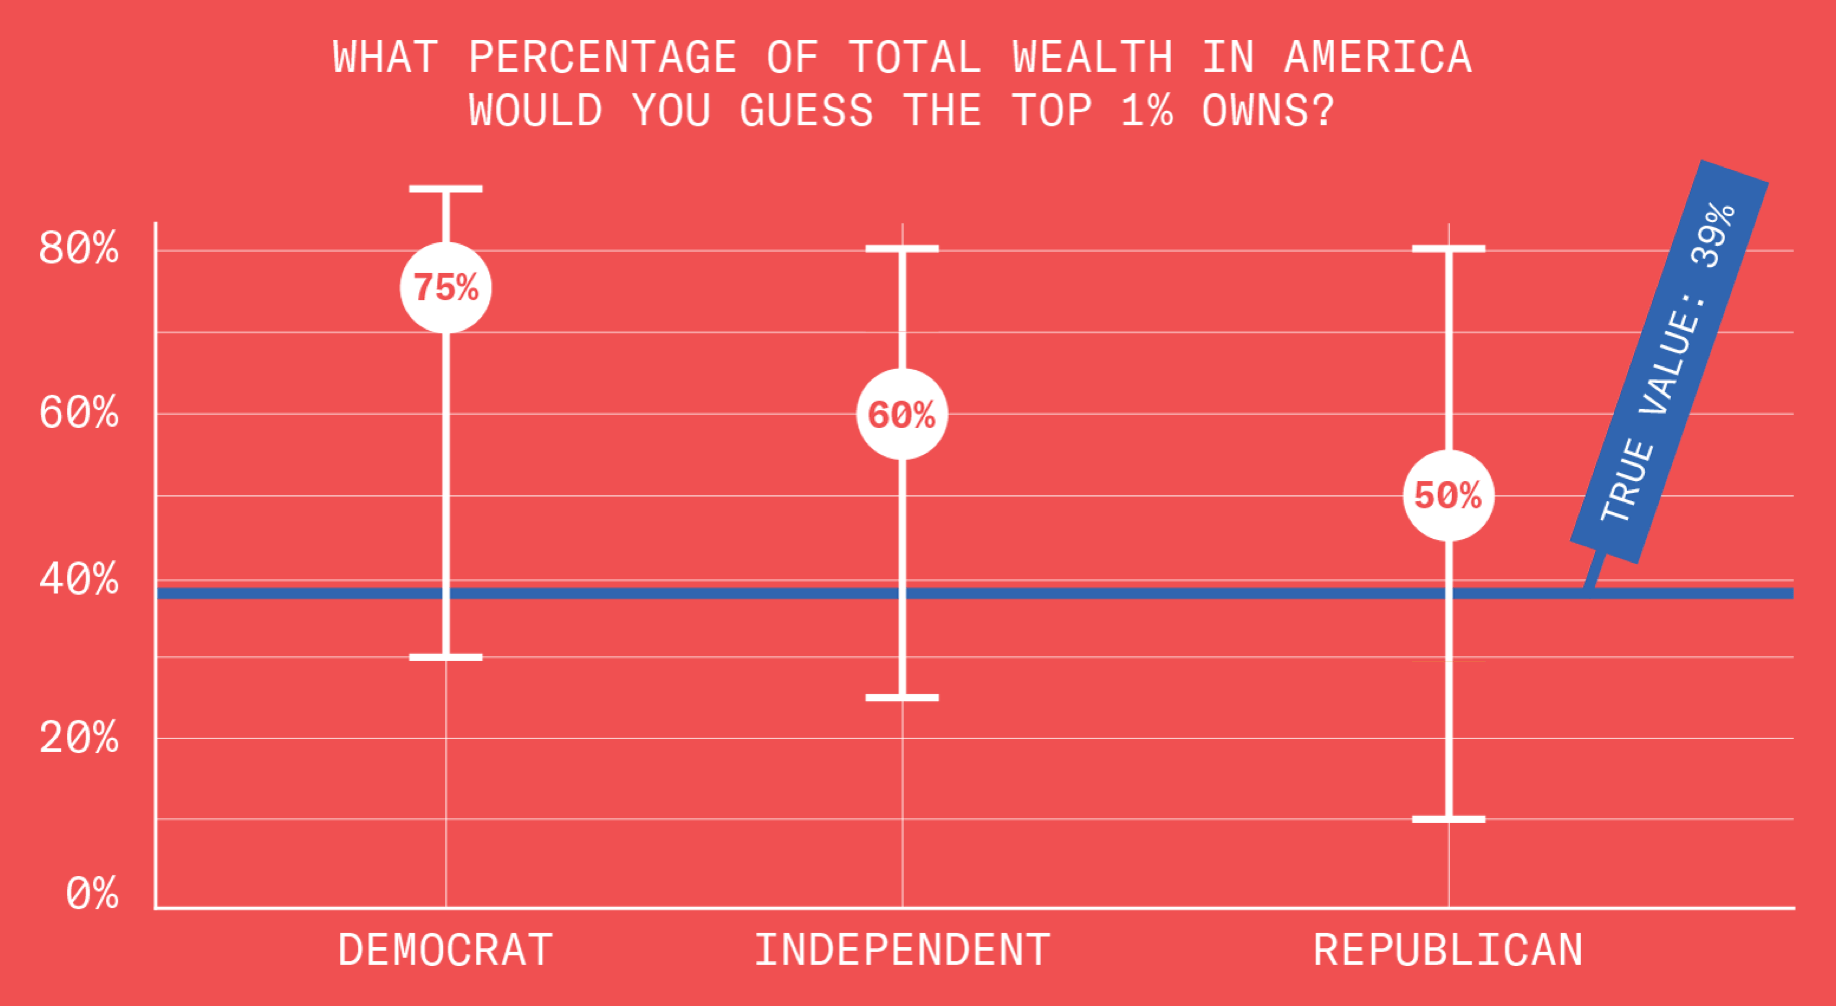
Estimating Equality – 3 of 3
The more educated you are, the more you overestimate how wealthy the top 1% is.
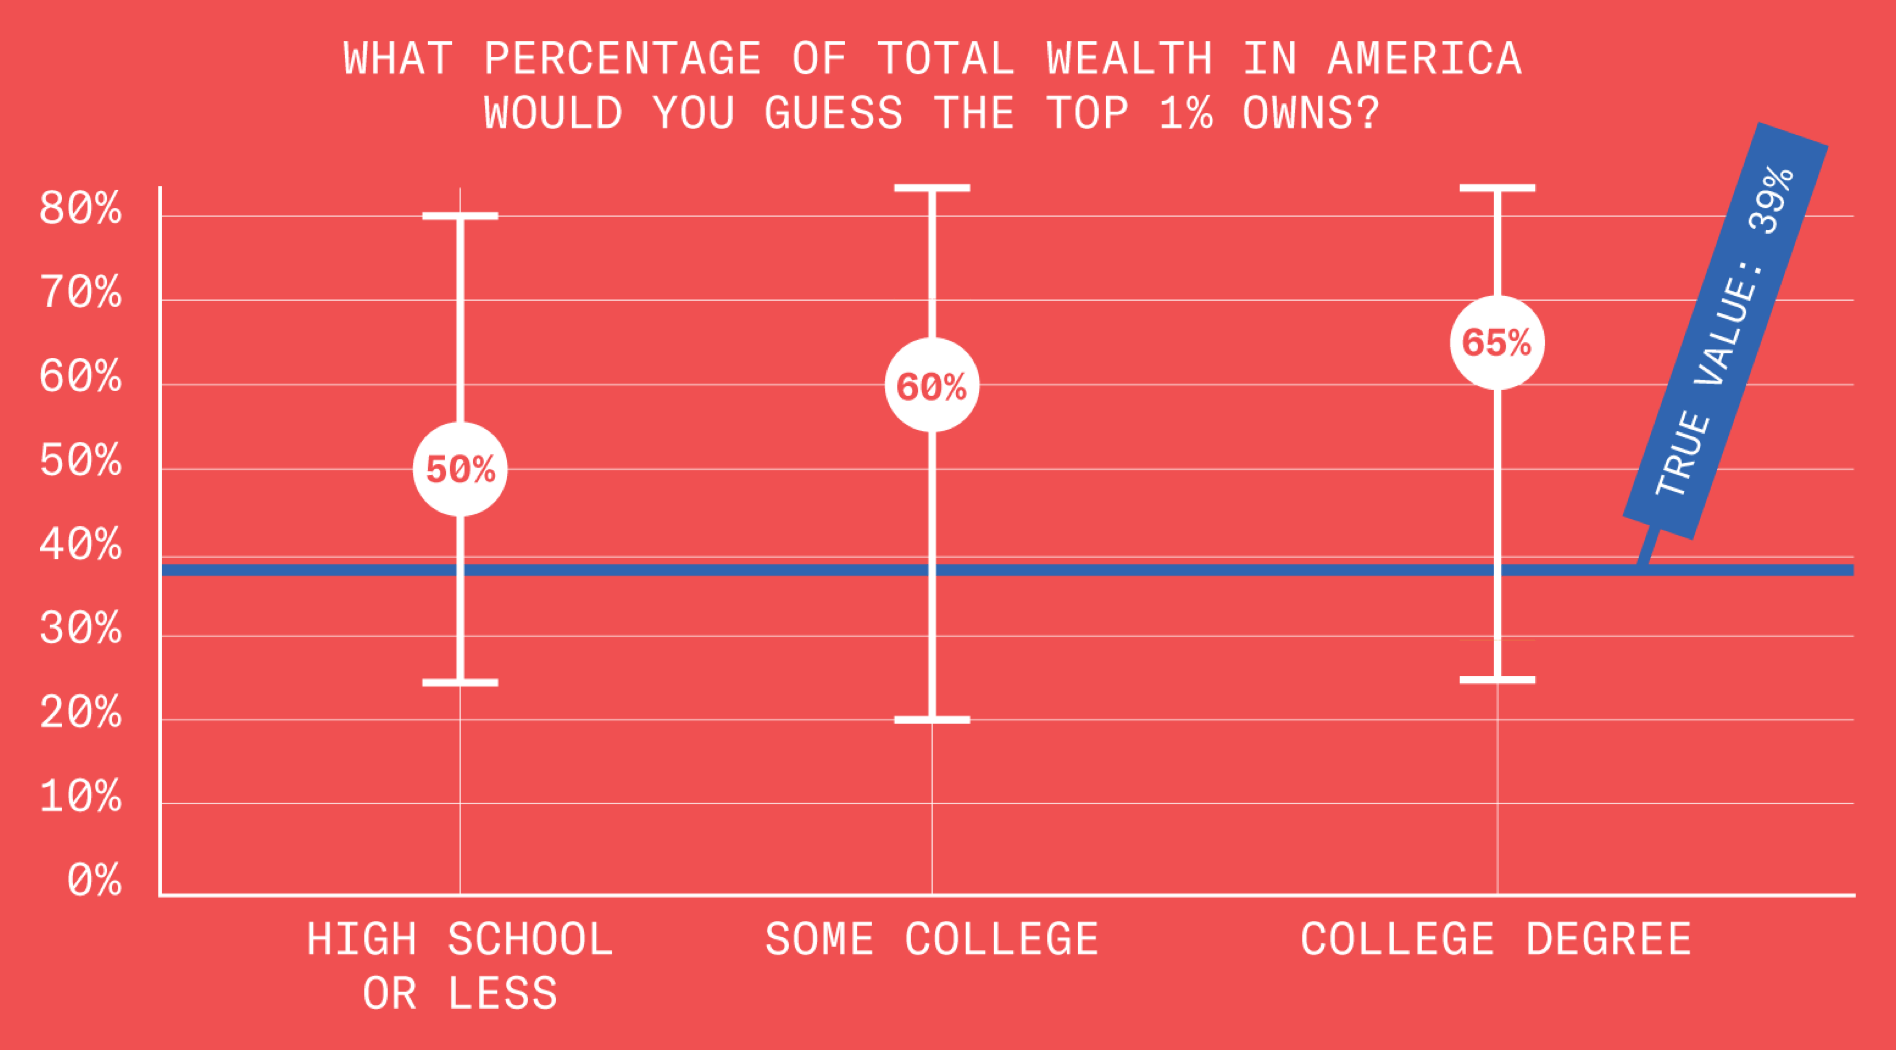
We were expecting people to underestimate inequality so that we could smugly correct them. Womp womp.
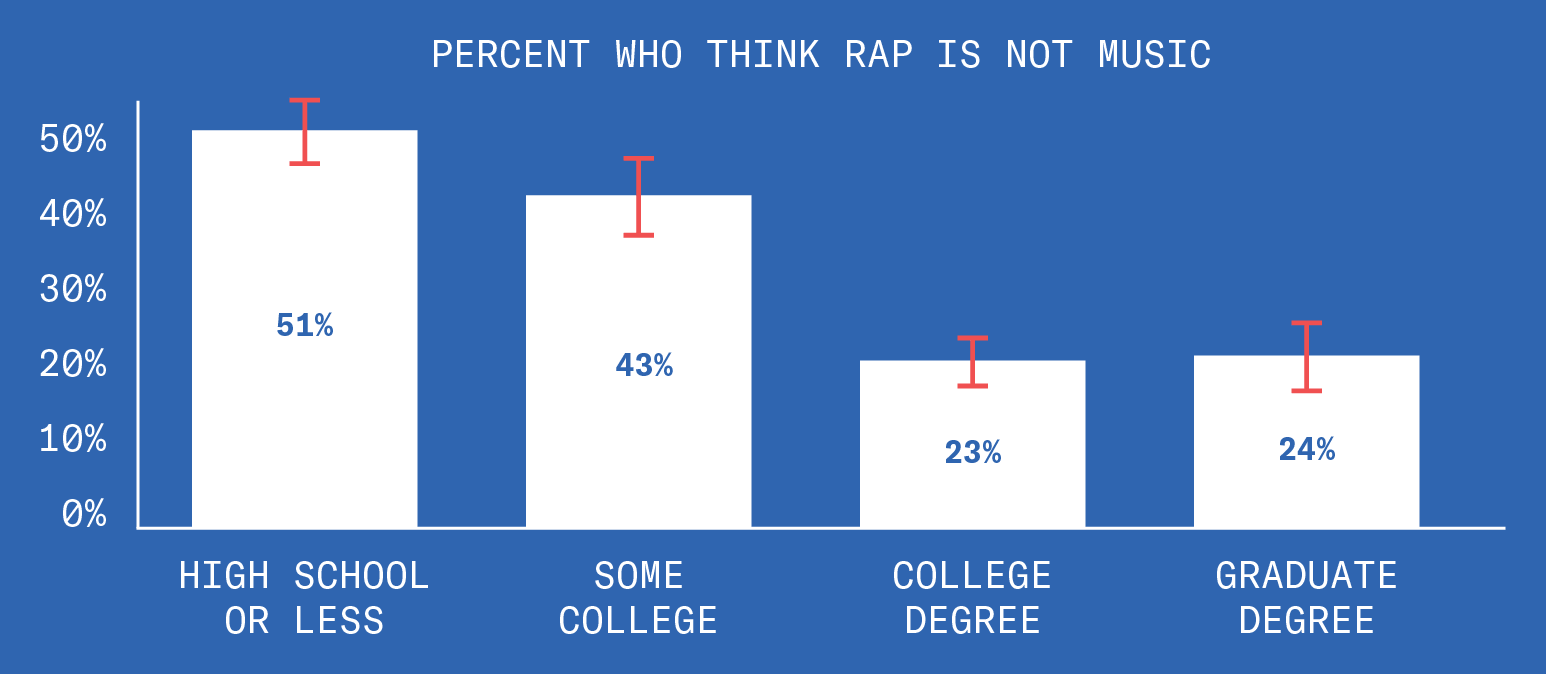
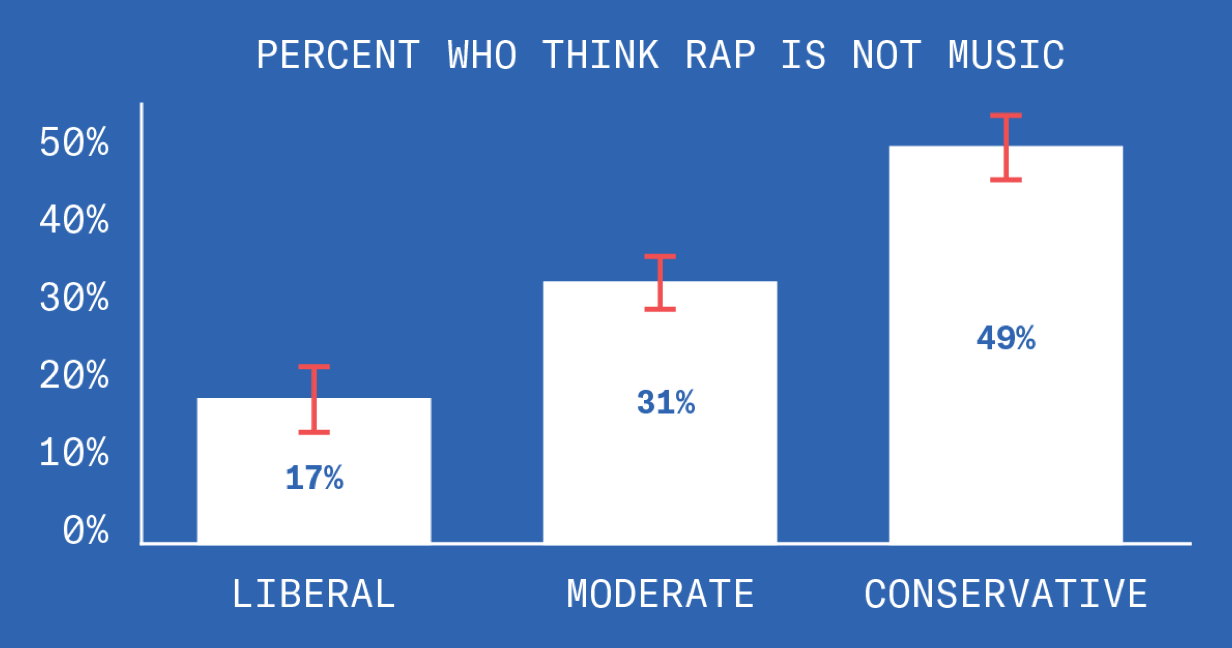
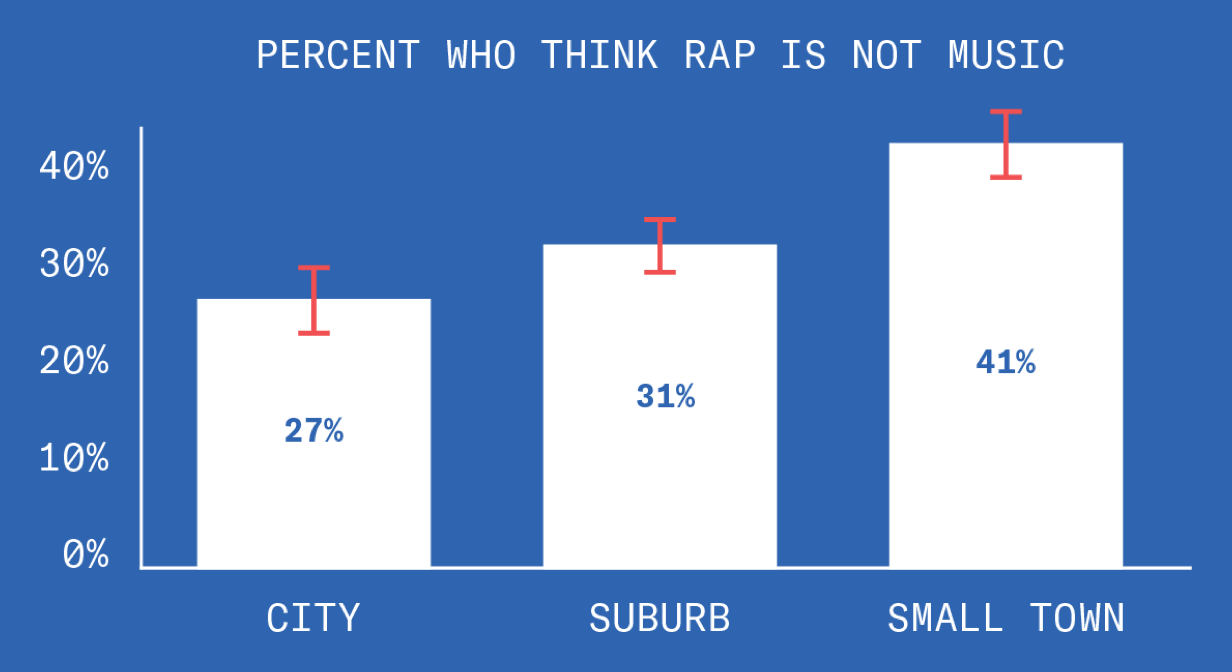
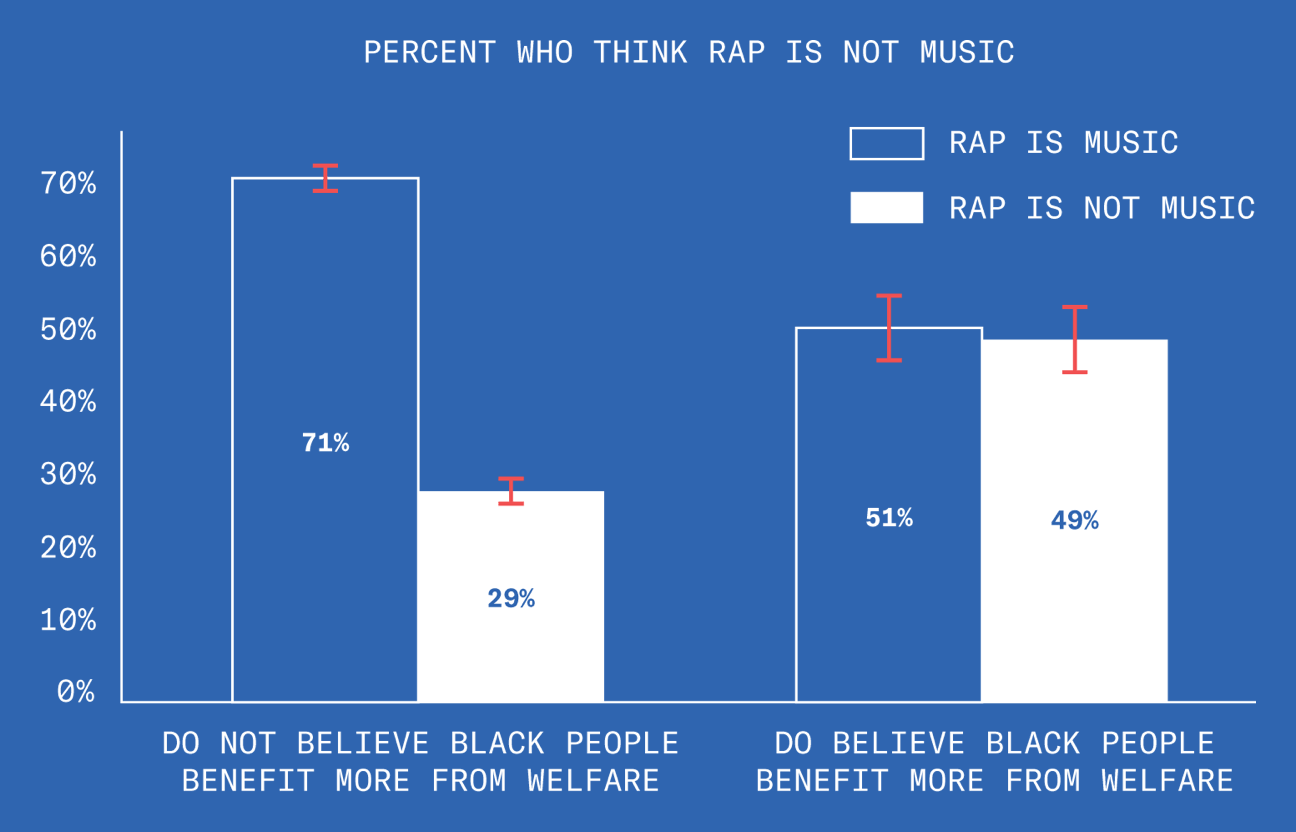
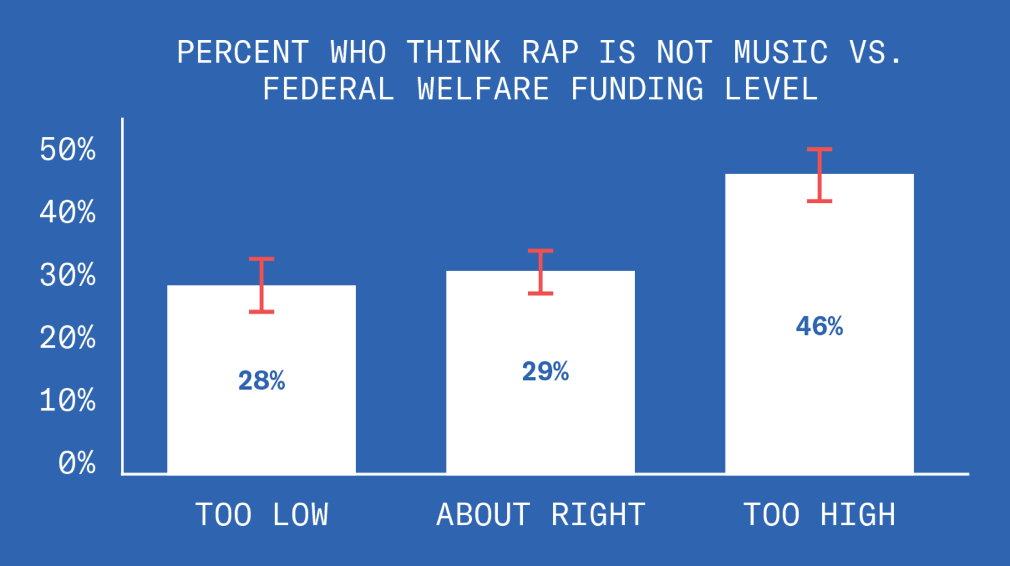
Rap
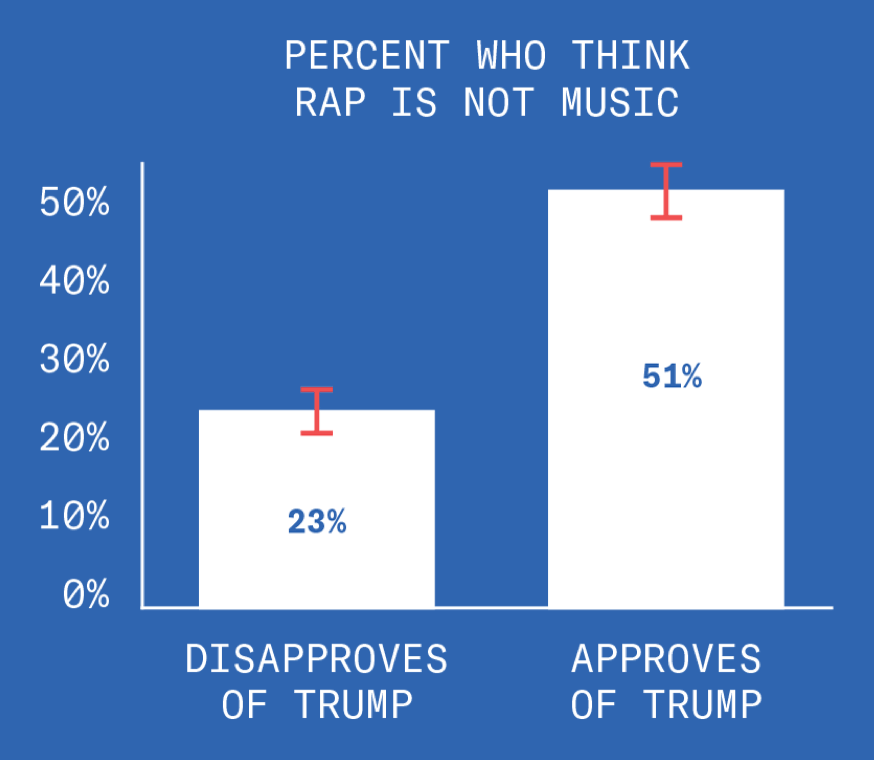
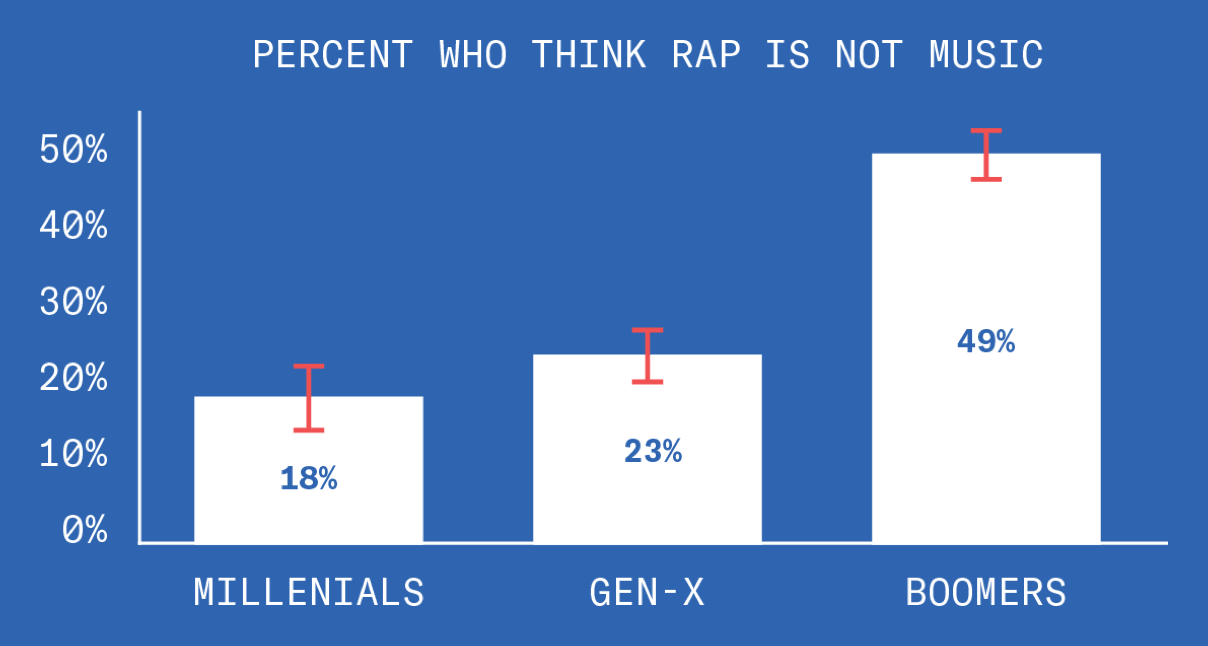
Is rap music? This is a very complicated question.
How you answer this question reveals a lot about the kind of person you are. People who don’t think rap is music are more likely to be older, rural, uneducated, conservative, approve of Trump, oppose welfare, and think black people benefit from welfare more than white people.
Rap – 2 of 8
Yep.
Rap – 3 of 8
Yep.
Rap – 4 of 8
Yep.
Rap – 5 of 8
Yep.
Rap – 6 of 8
Yep.
Rap – 7 of 8
Yep.
Rap – 8 of 8
This might be a good question to ask on a first date.
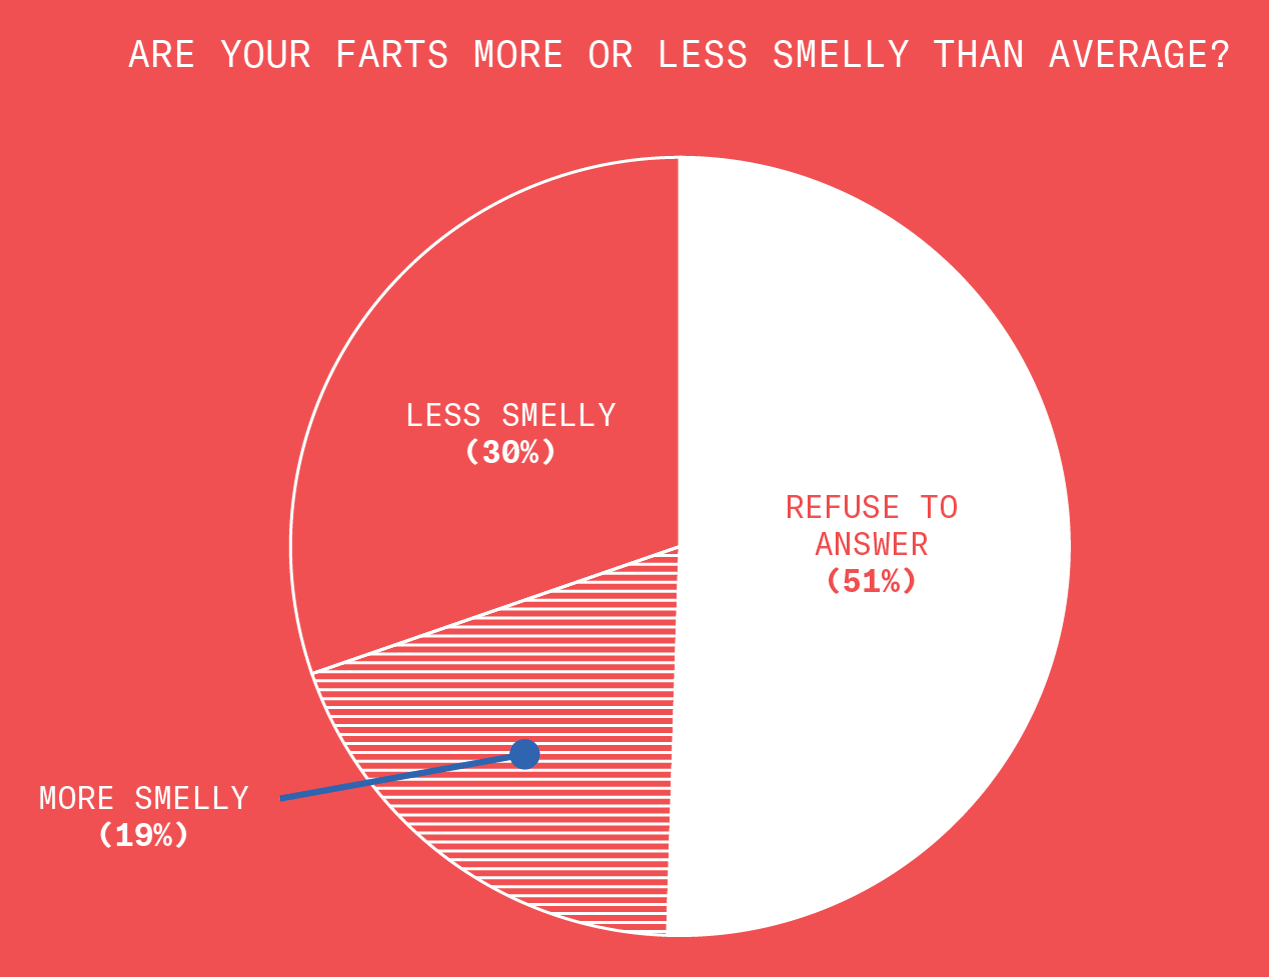
Farts
Because we could, we asked people if they thought their farts were more smelly or less smelly than other people’s farts. This question made people extremely uncomfortable: about half of respondents refused to answer or hung up the phone. Good thing we asked this question last.
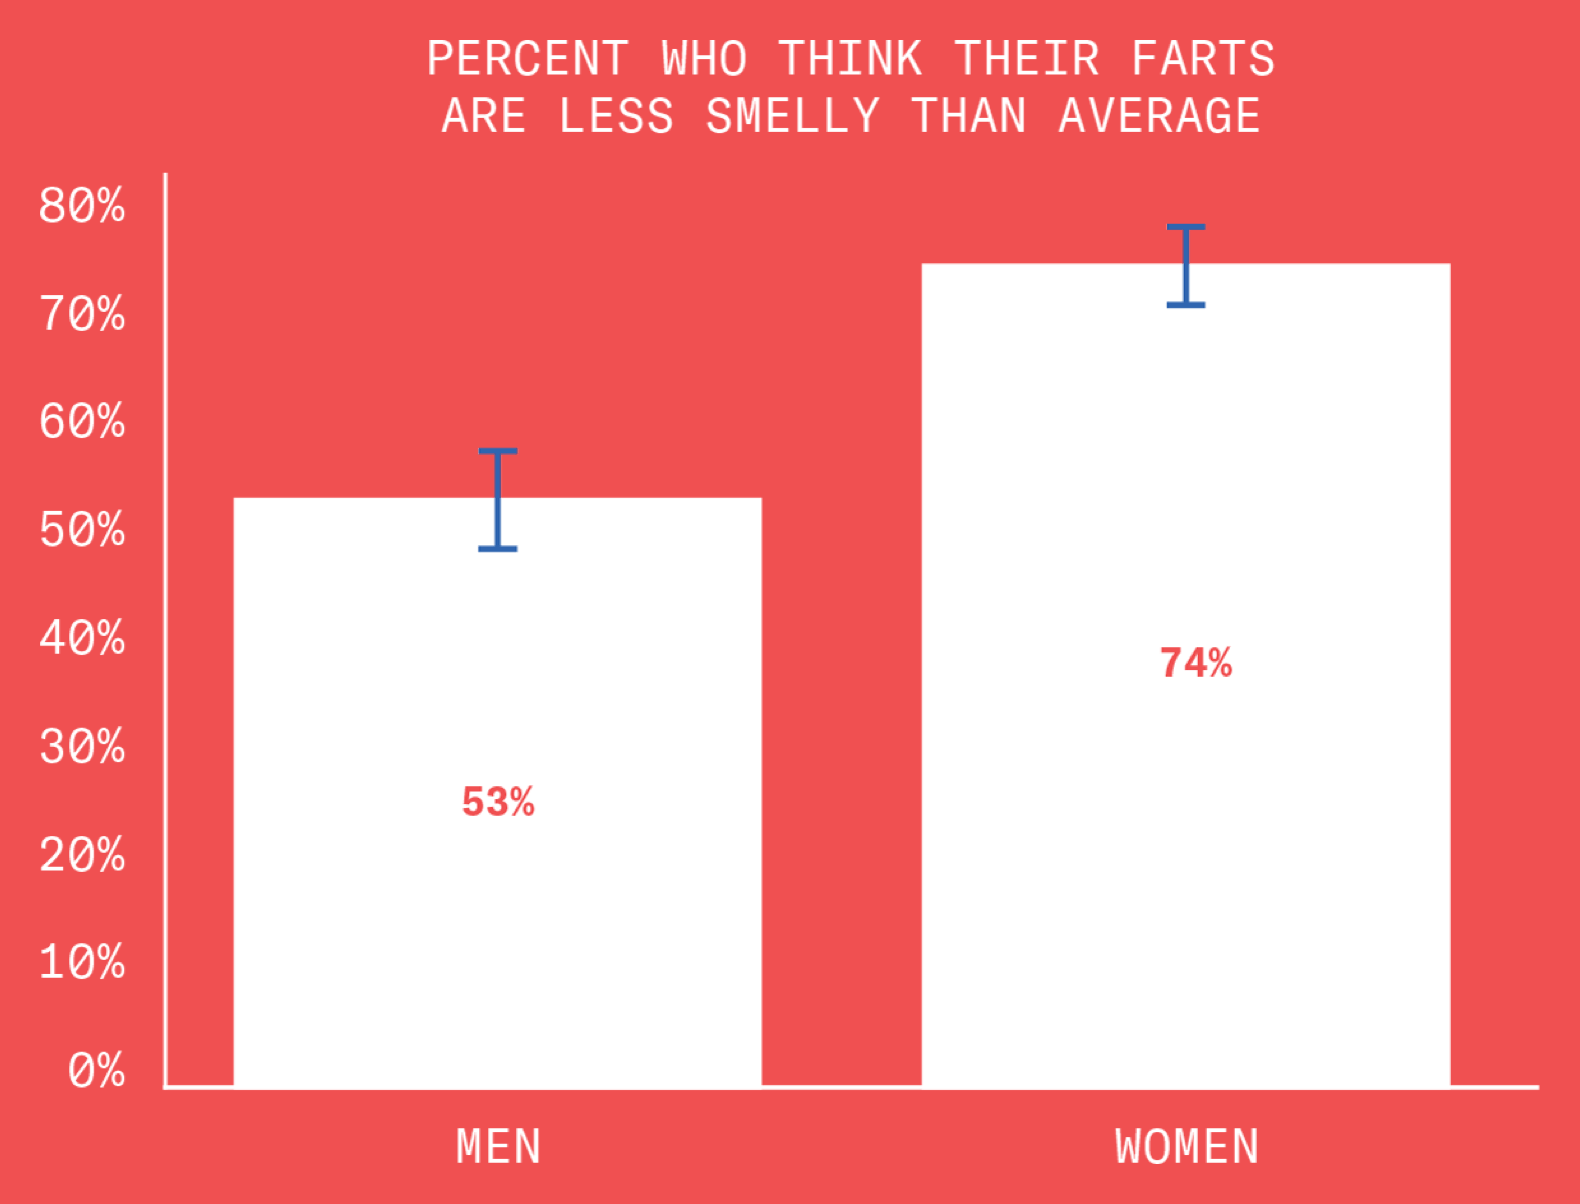
Farts – 2 of 3
Women thought more highly of their farts than men.
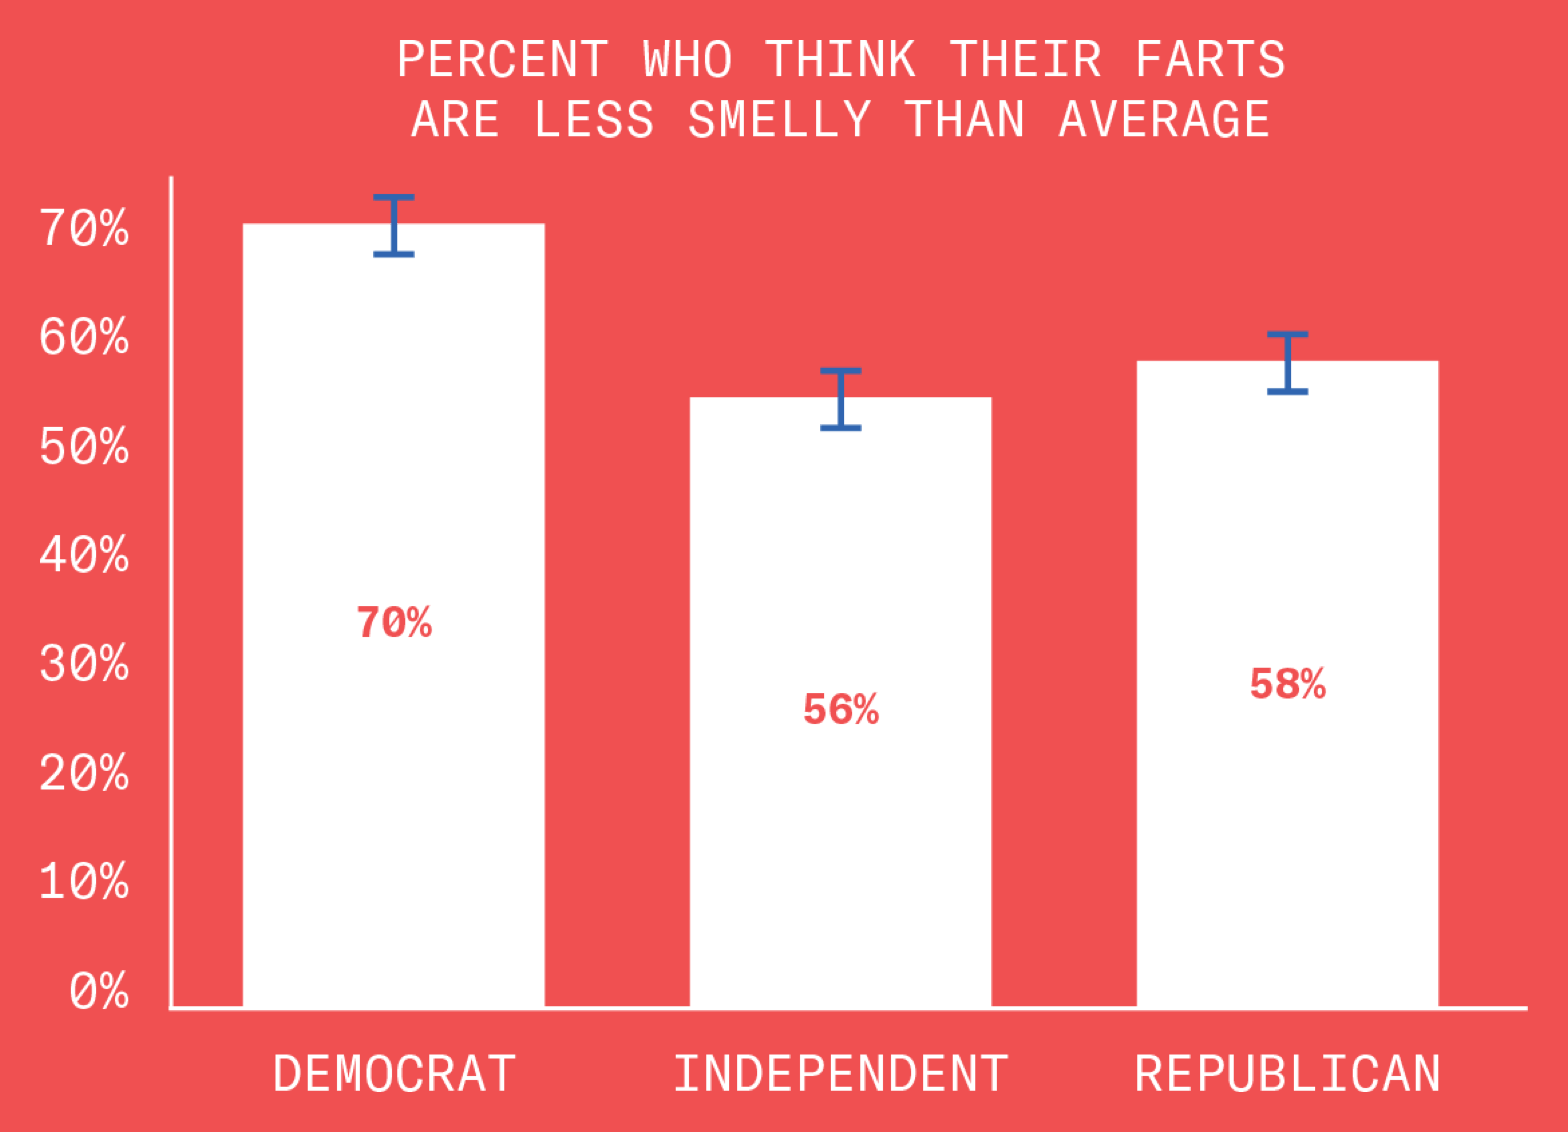
Farts – 3 of 3
And here’s one that Republicans can enjoy: Democrats like the smell of their own farts.
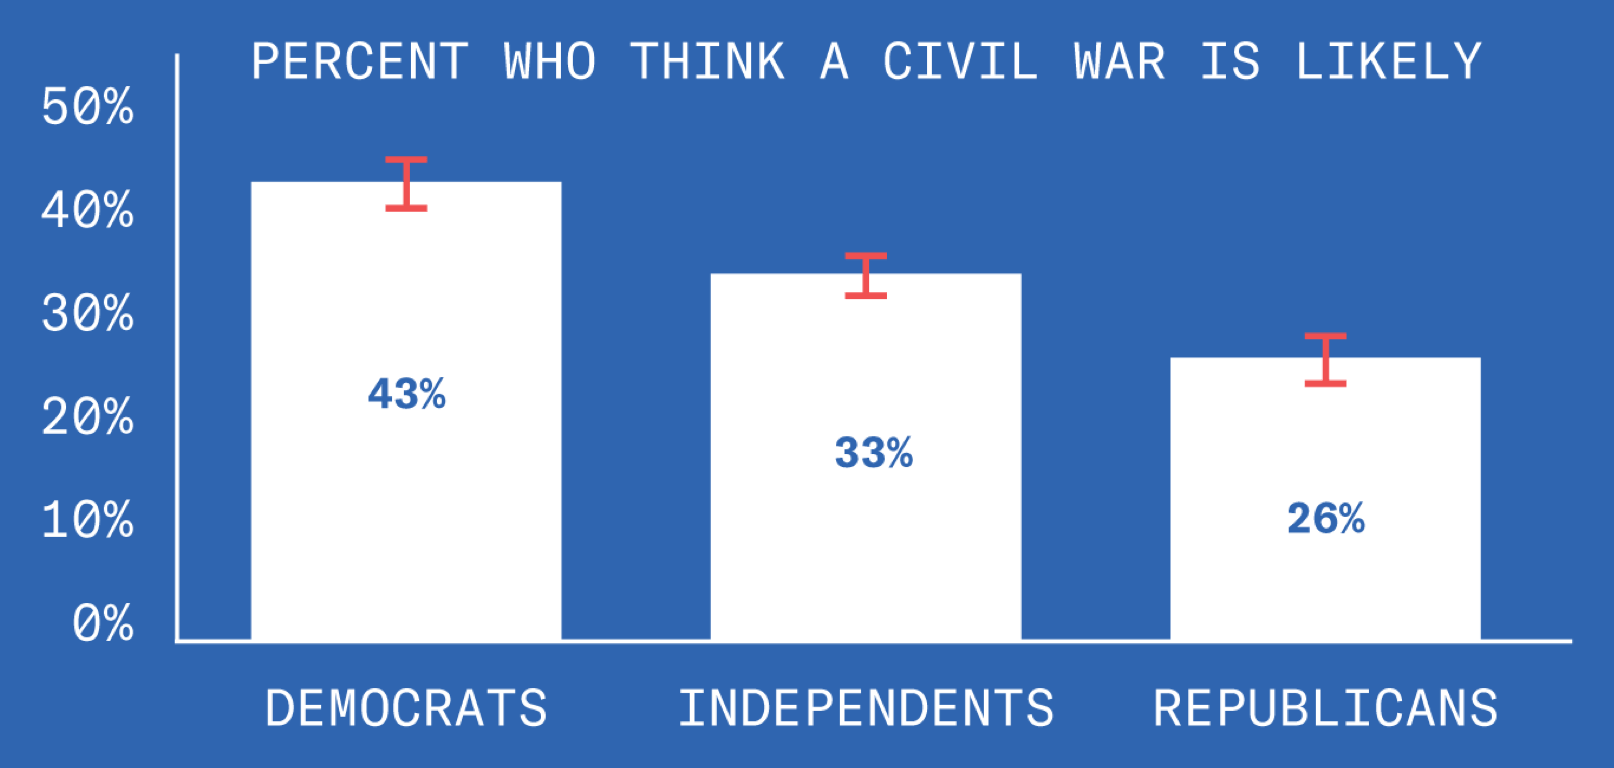
Civil War II
We asked people whether they thought it was likely that there would be a civil war within the next decade.
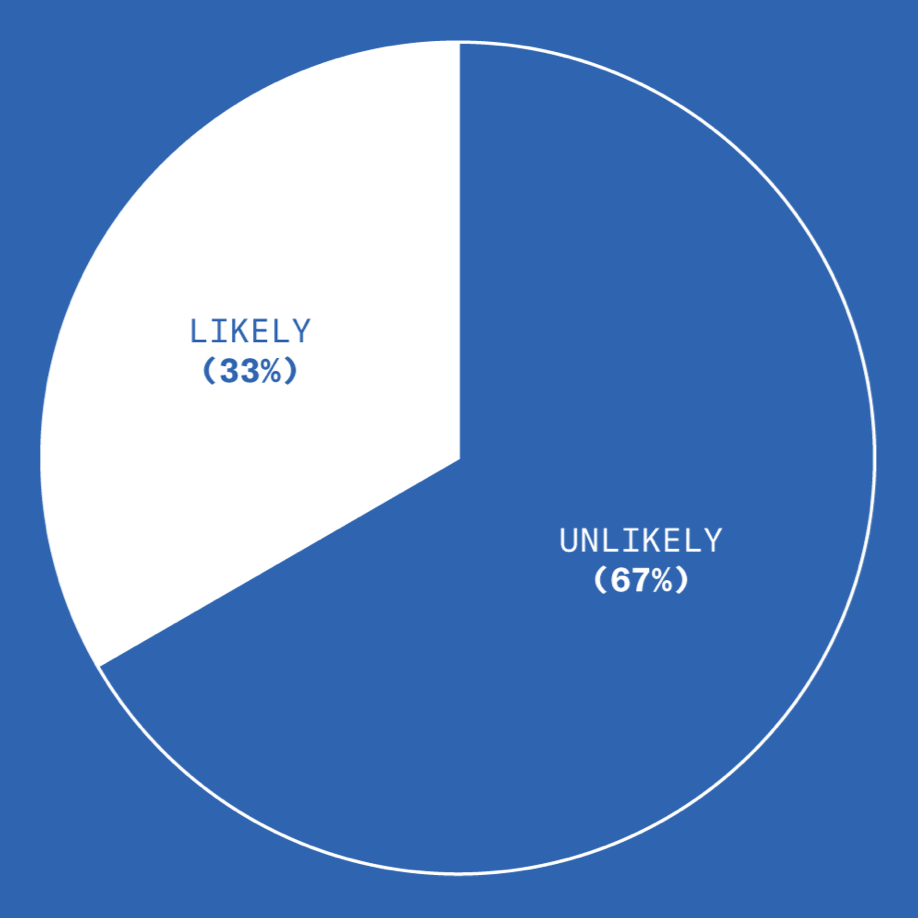
Fuck. We found that one in three Americans think a Civil War is likely. Fuck!
Civil War II – 2 of 3
Democrats are almost twice as worried about civil war as Republicans. This is even more worrying because Democrats are usually right about things.
Civil War II – 3 of 3
People who are worried about civil war are more likely to support Dwayne “The Rock” Johnson as a candidate for president.
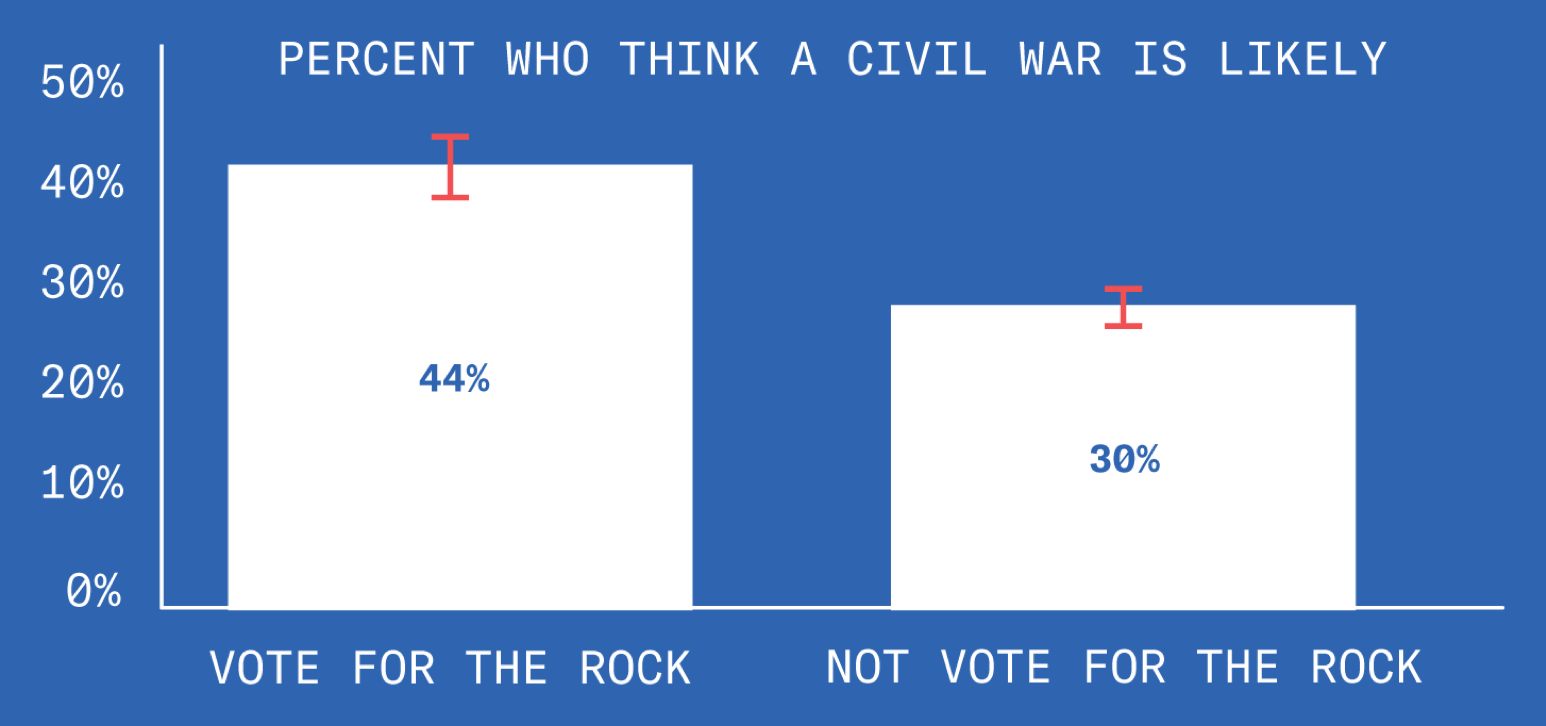
Maybe people worried about a civil war are looking to unite the country behind a universally beloved celebrity. Or maybe they’re looking for someone with prior military experience as a Scorpion King.
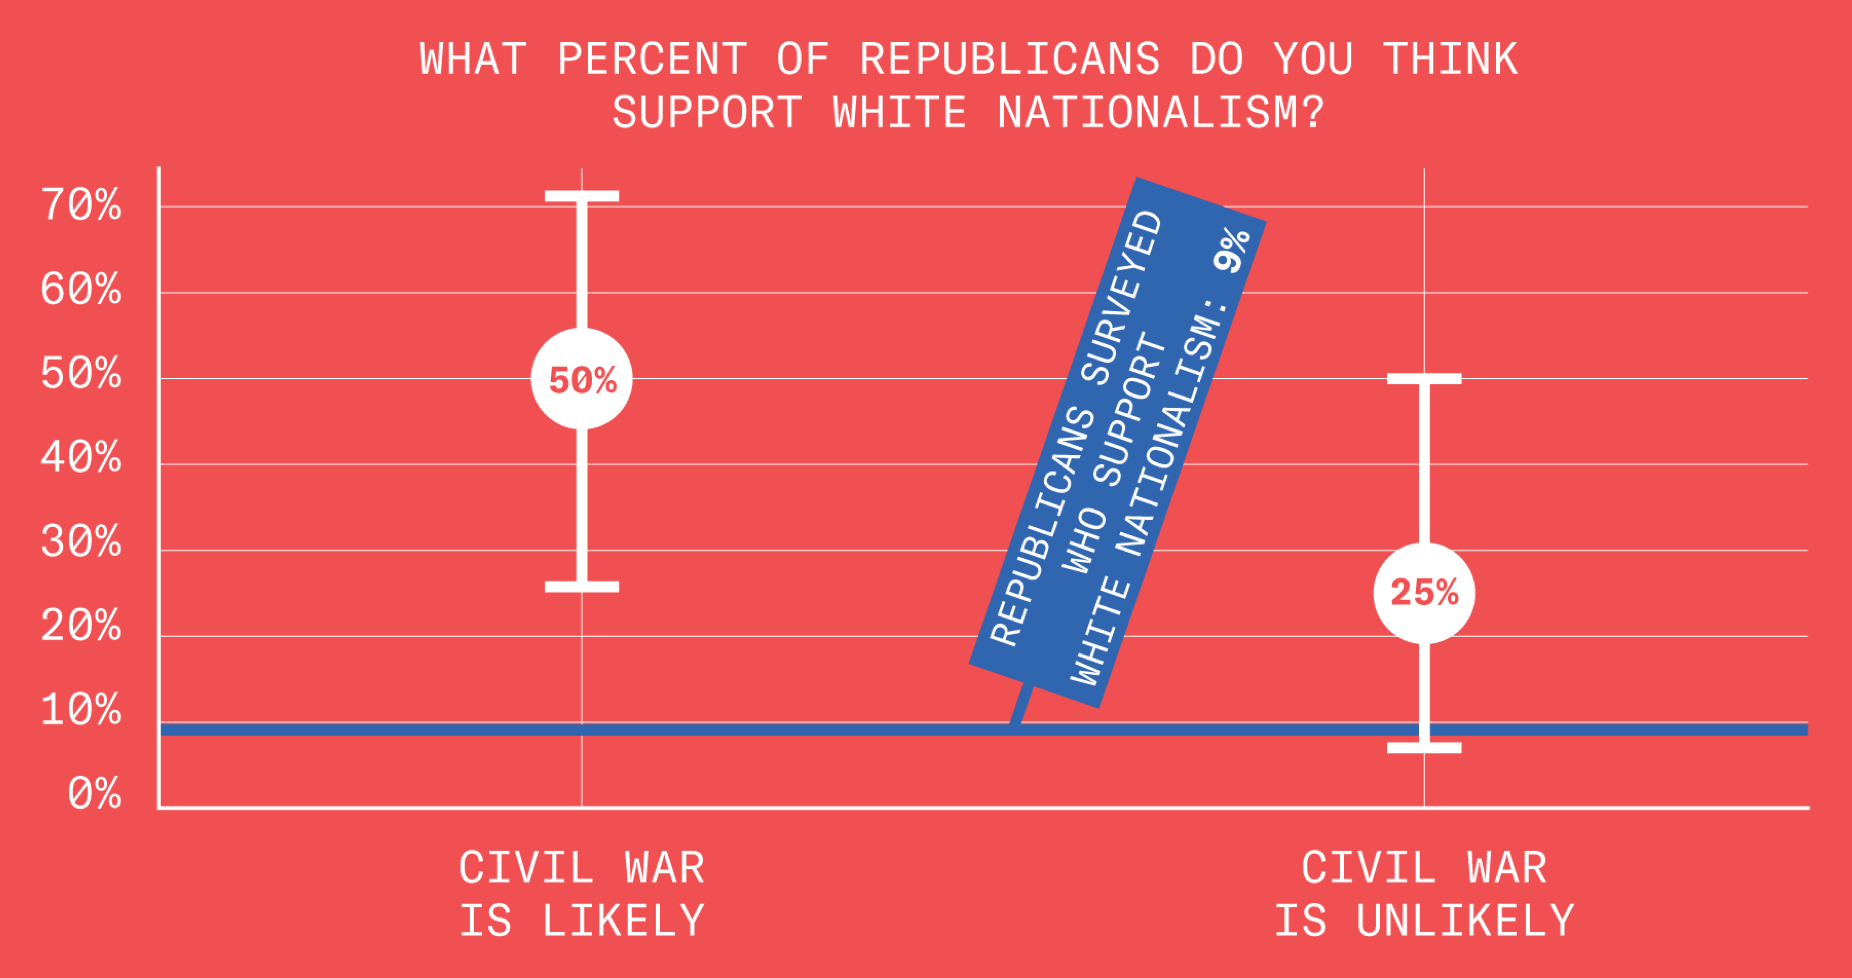
The Other Side
We asked people if they supported white nationalism, and only 9% of Republicans said yes (assuming, very generously, that they all understood the question).
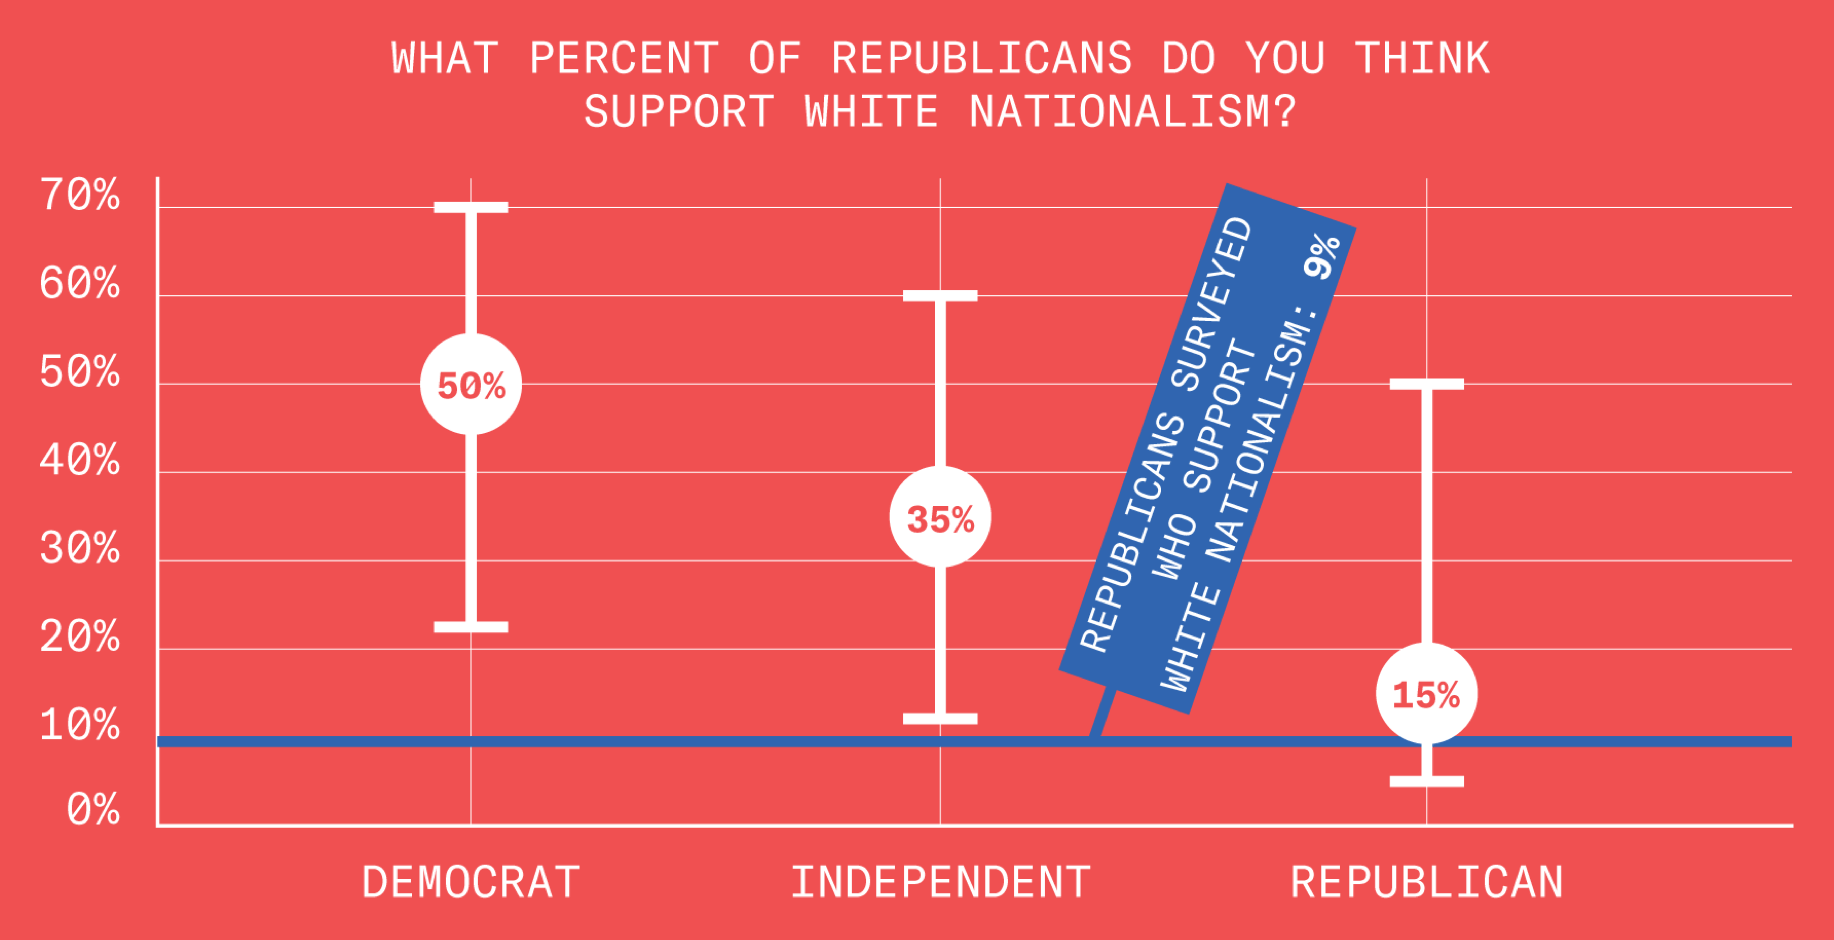
Then, we had everybody guess the percentage of Republicans who supported white nationalism.
The Other Side – 2 of 3
Democrats and Independents overestimate Republicans’ support for white nationalism.
Even Republicans overestimate their own party’s support for white nationalism. On average, those who are worried about civil war vastly overestimate Republicans’ support for white nationalism.
The Other Side – 3 of 3
Republicans’ views of Democrats are not so accurate, either. Though 96% of Democrats say they love America, Republicans greatly underestimate this number.
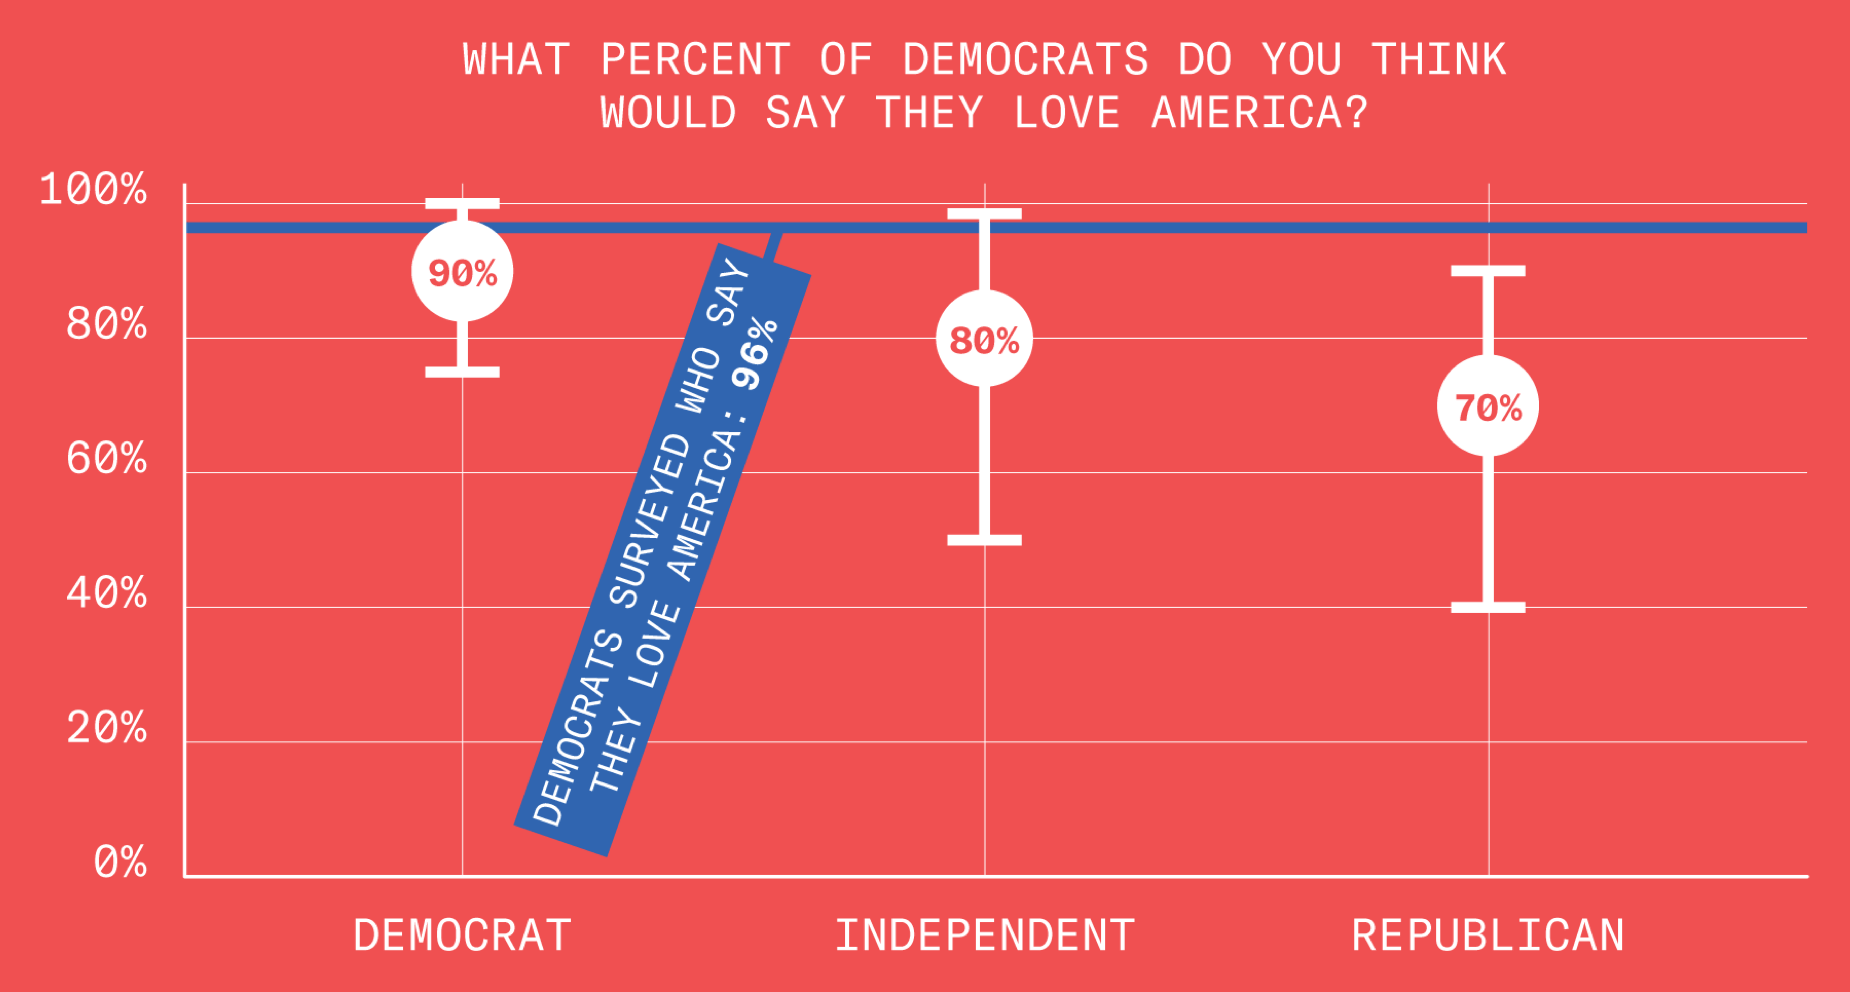
Neither Democrats nor Republicans have any idea what the other side believes. Americans are united in their refusal to understand anyone who disagrees with them. It’s kind of beautiful when you think about it.
Fun Facts About Racism
According to our Twitter feeds, calling white people racists is an important American pastime. Just how racist do Americans think white people are?
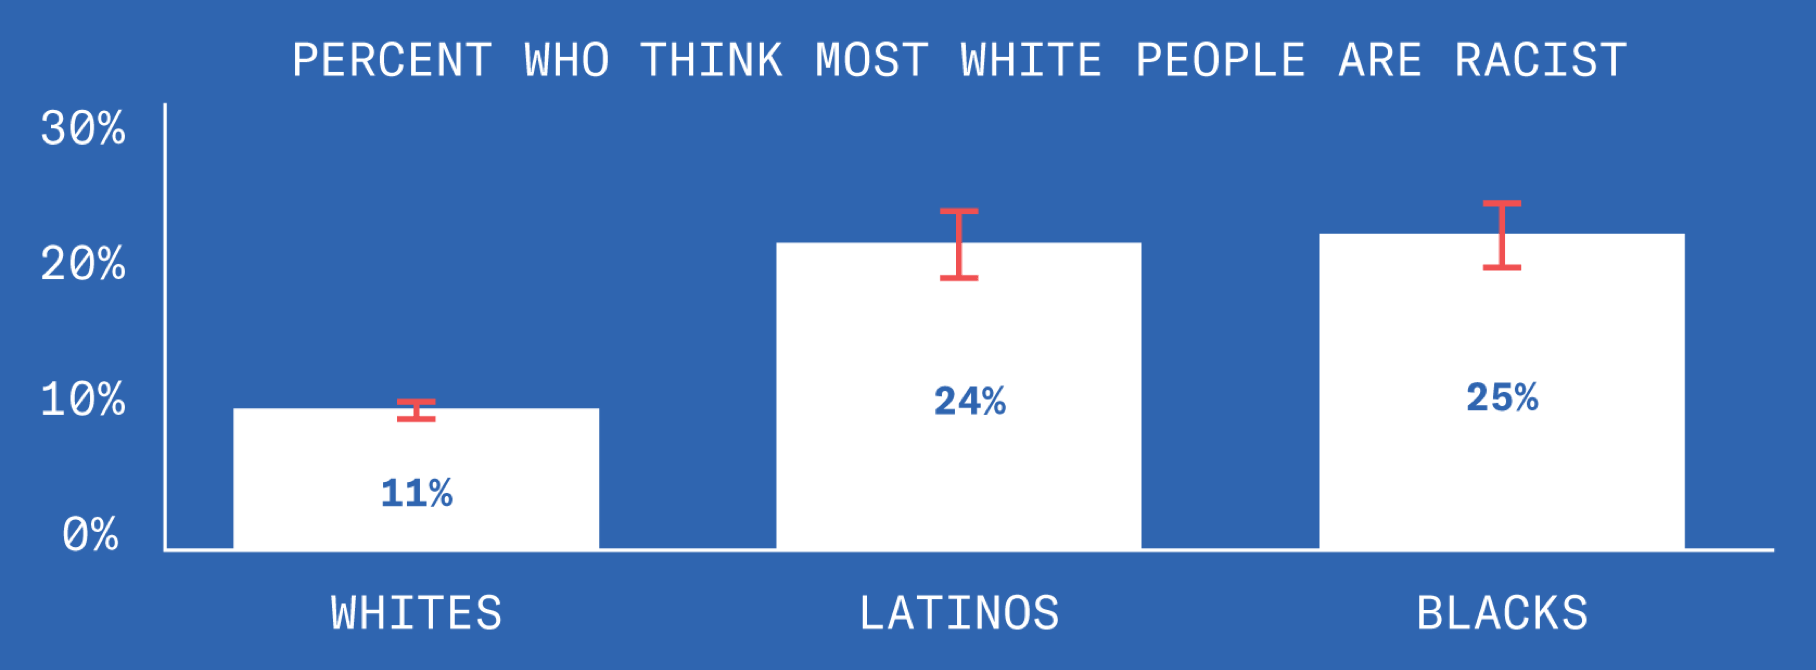
Across demographics, most people incorrectly believe that white people are not racist. Black and Latino people are twice as likely to correctly believe that white people are, indeed, racist.
Fun Facts About Racism – 2 of 3
Now for the tricky bit. We asked people to guess how many Democrats thought most white people are racist. While only 21% of Democrats actually think most white people are racist, everyone overestimated this number.
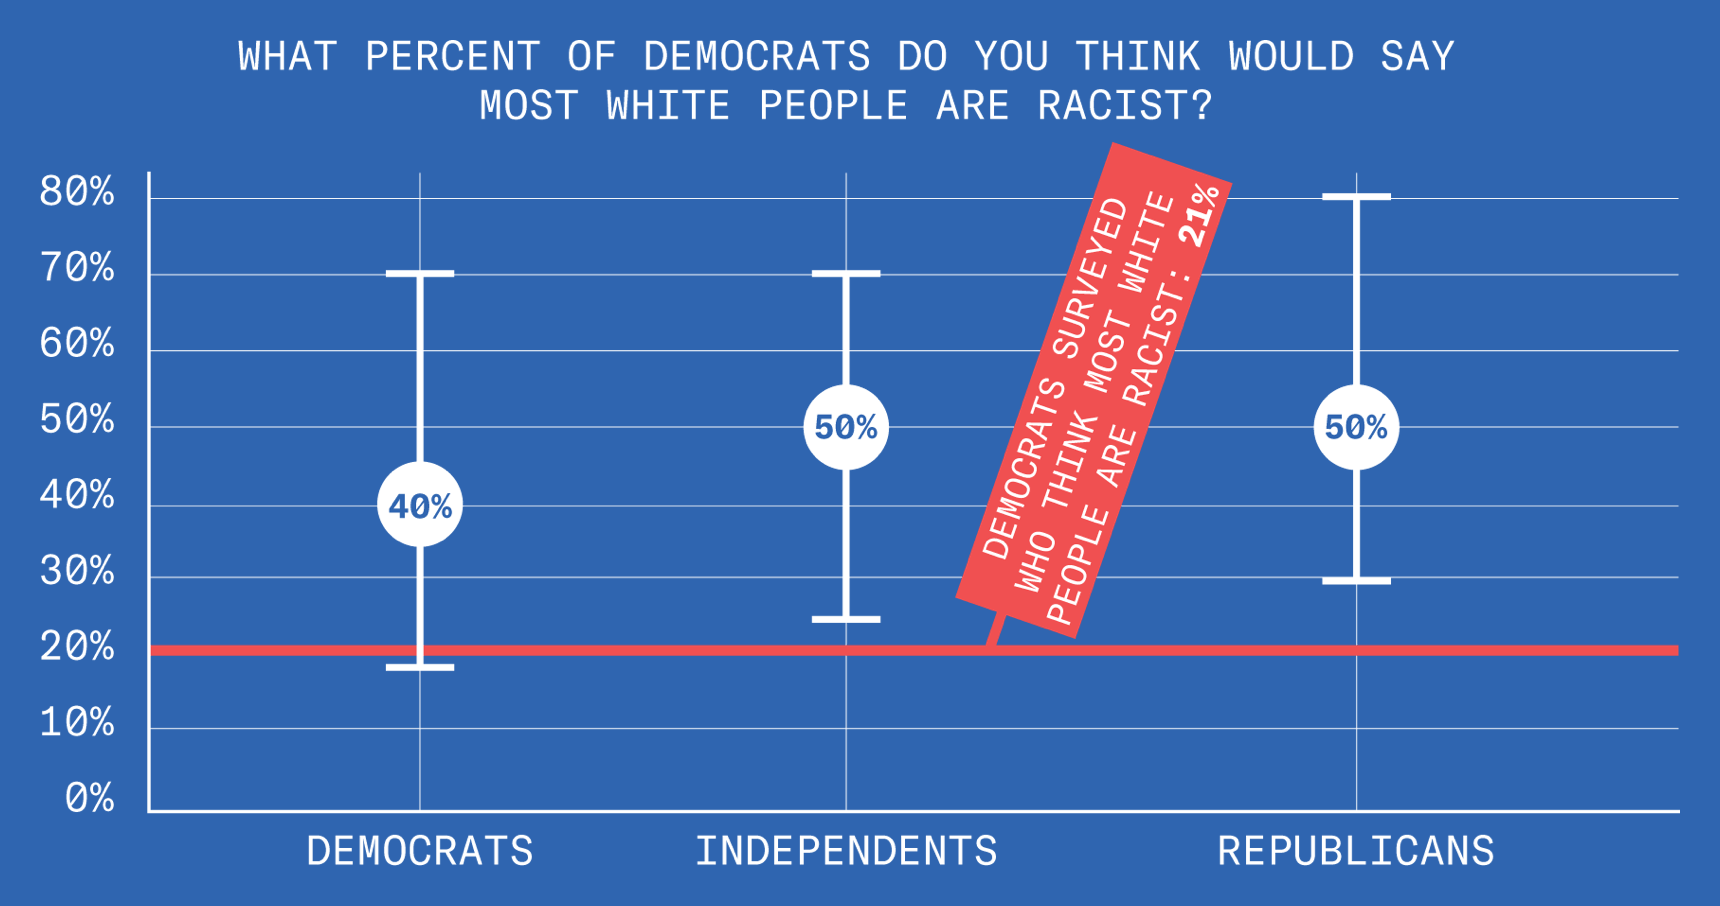
Most people think Democrats think most white people are racist, but very few Democrats actually do. TL;DR: everyone overestimates how much Democrats hate white people.
Fun Facts About Racism – 3 of 3
All this talk about white people makes us wonder: what do black people think about all this? Turns out that they’re really worried about another civil war.
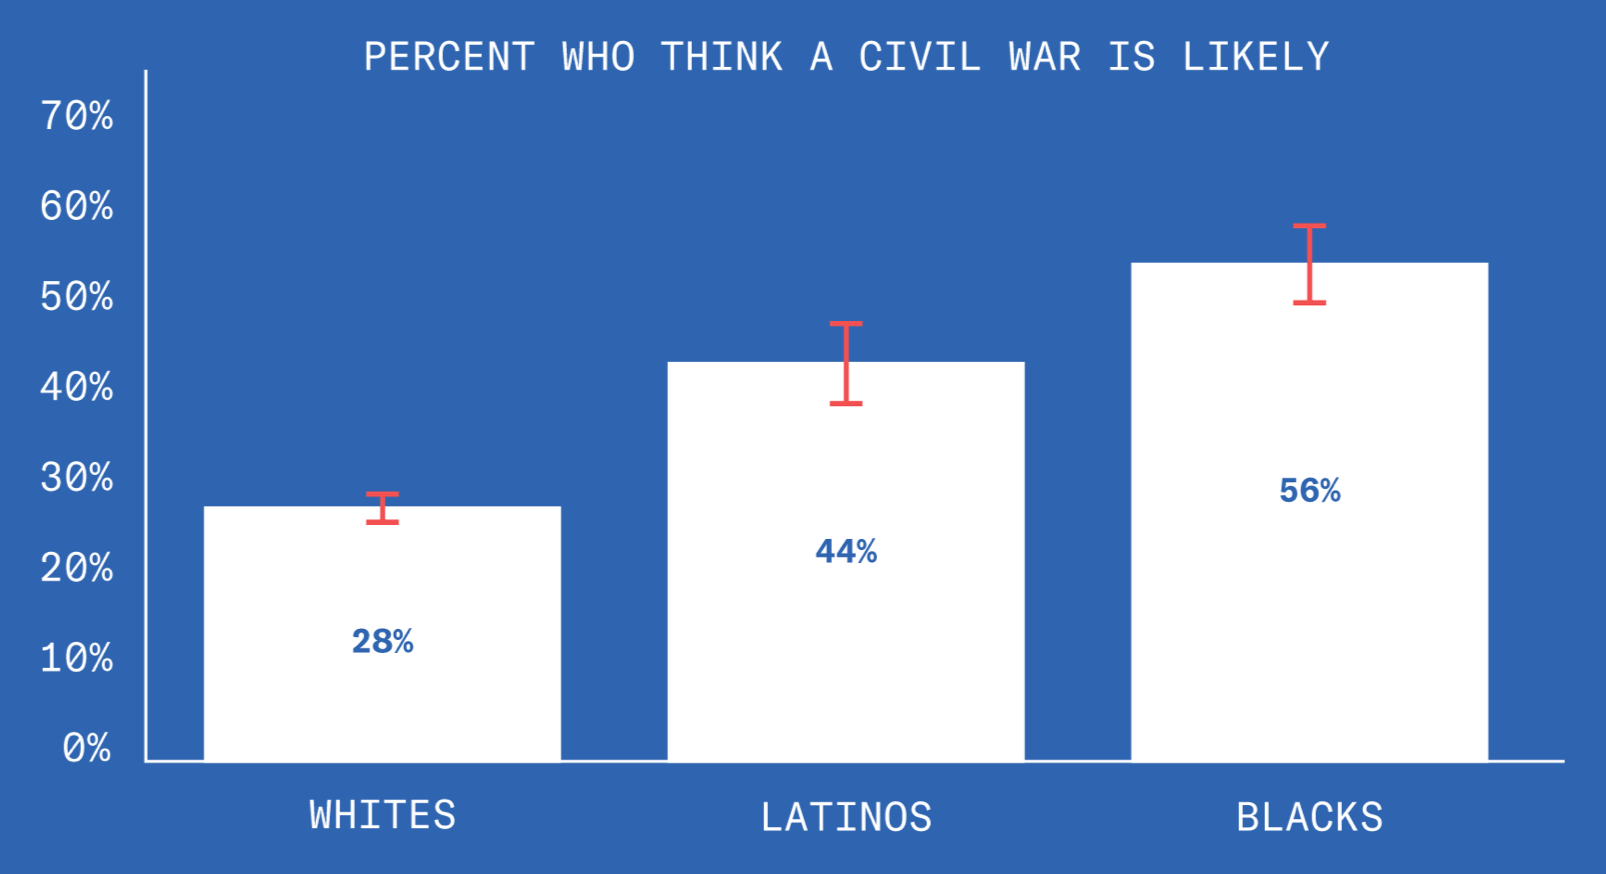
Maybe we should believe the Americans who had the most at stake in the previous Civil War.
The Power of the Dark Side
And finally, the simplest question of all: who would you rather have as President, Donald Trump or Darth Vader?
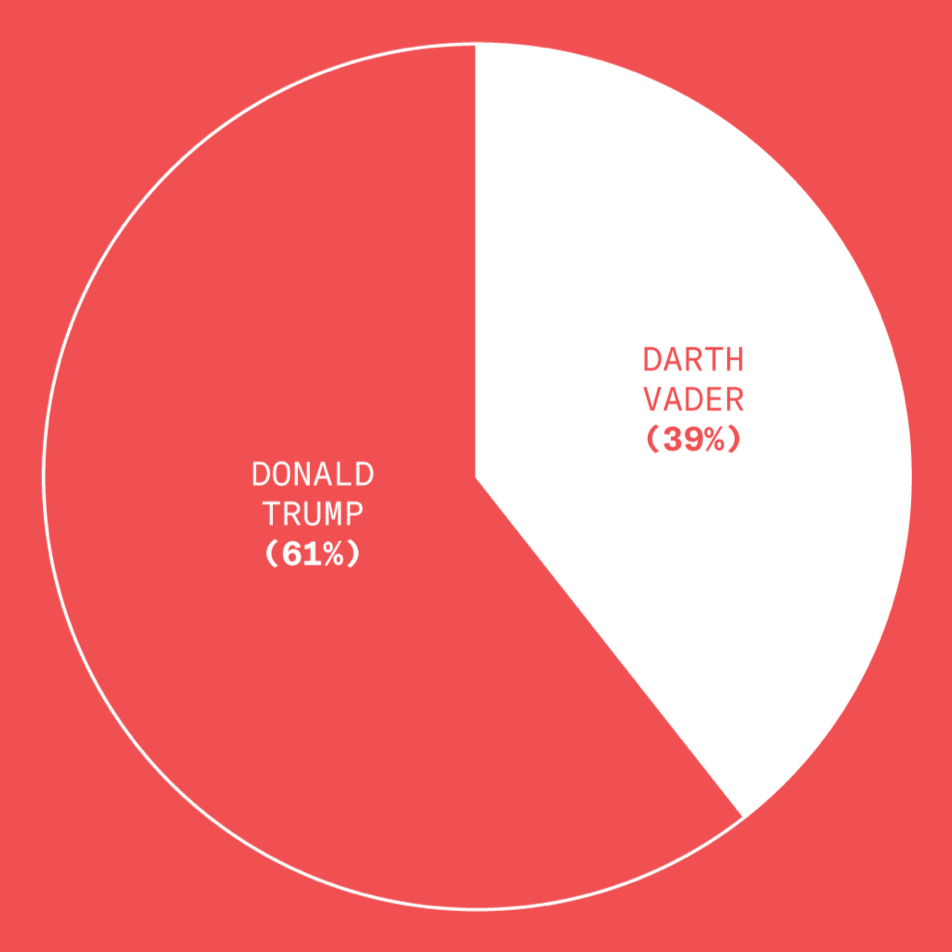
Pretty good showing for a fictional supervillain. Way to go, Darth!
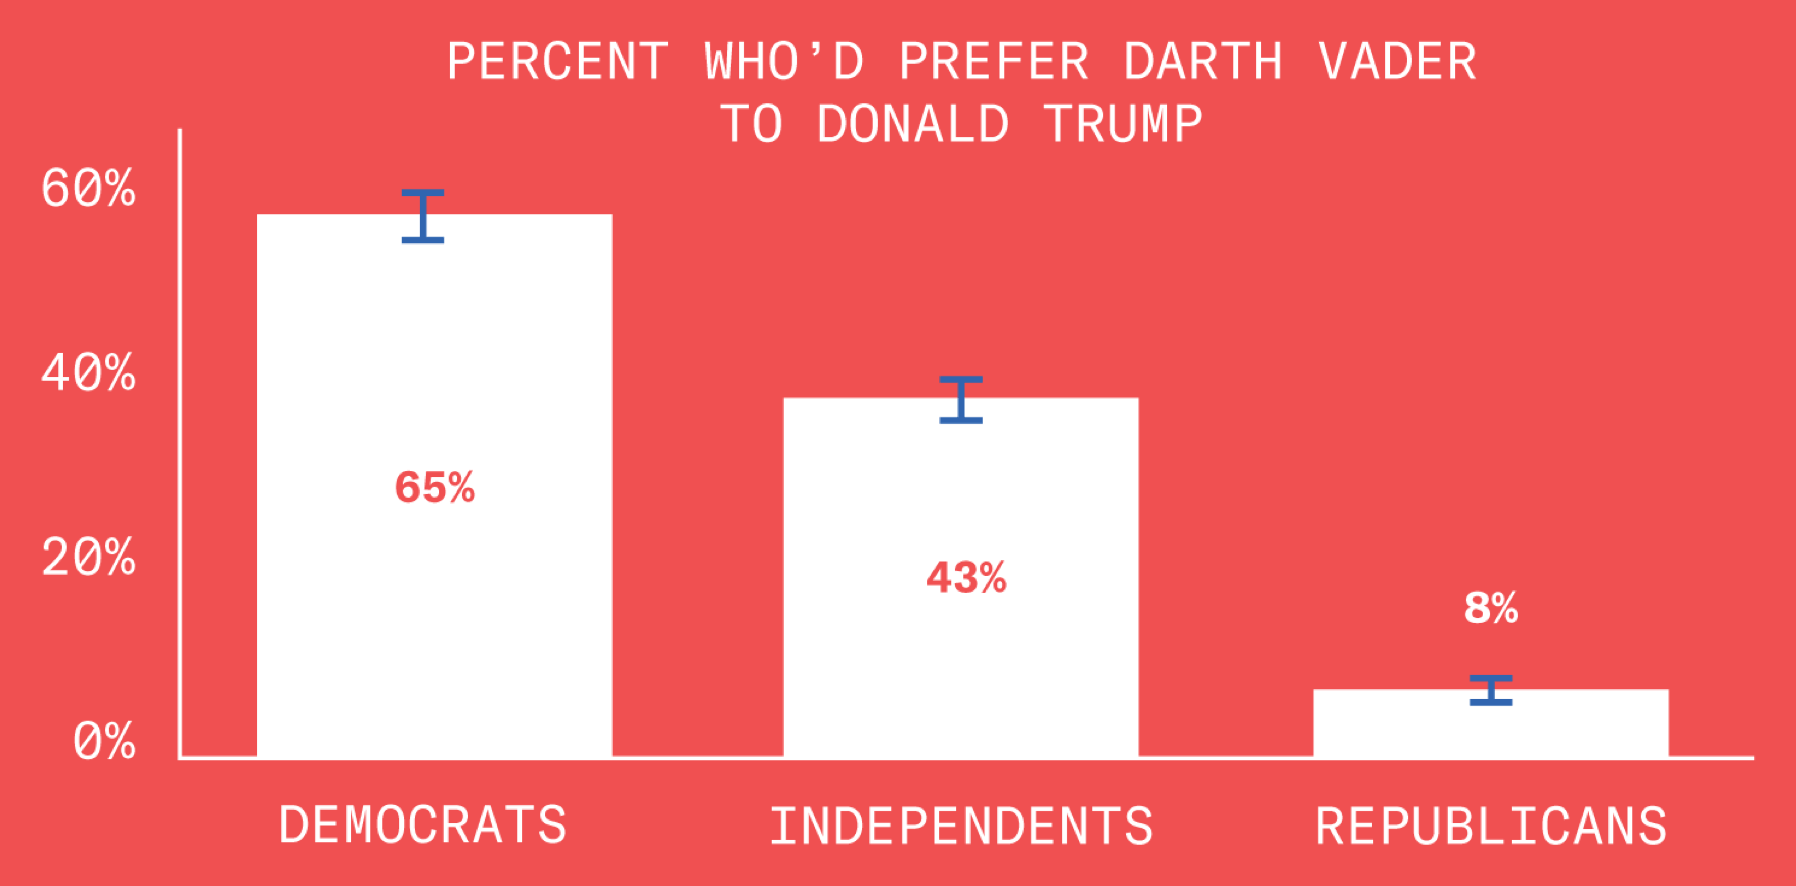
The Power of the Dark Side – 2 of 3
Fully 65% of Democrats, 43% of Independents, and even 8% of Republicans prefer the order of the Galactic Empire to the chaos of the Trump administration.
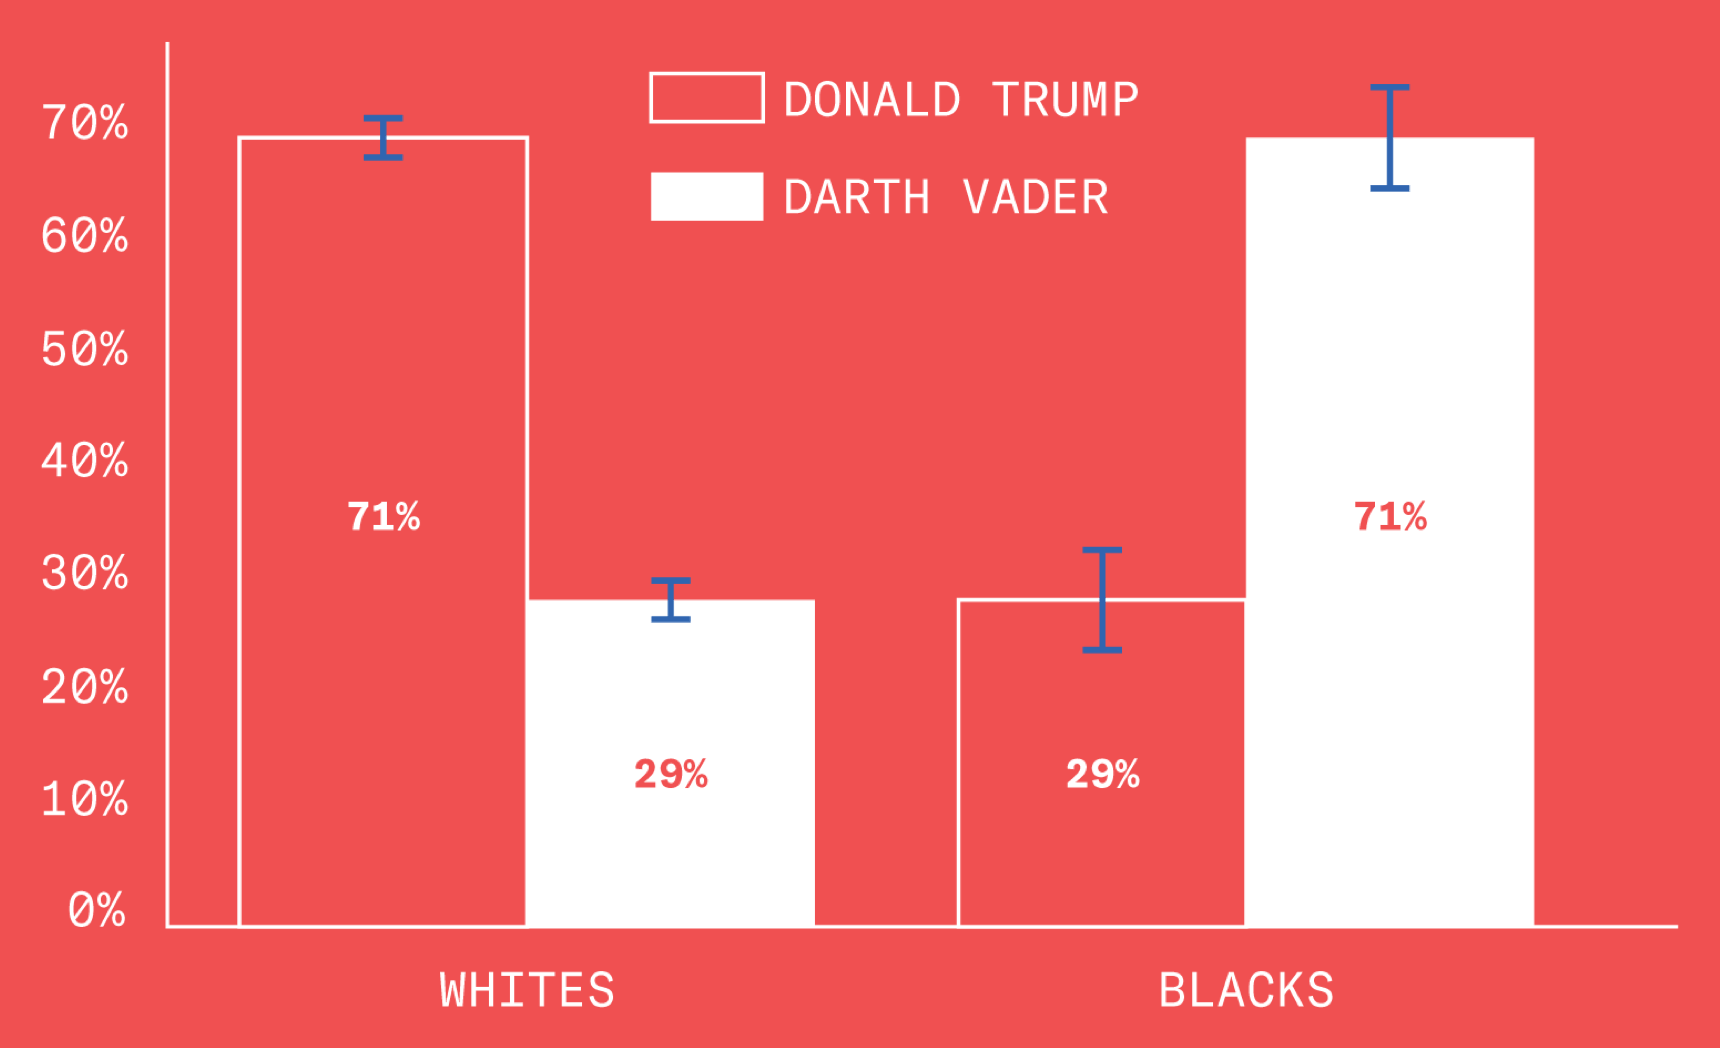
The Power of the Dark Side – 3 of 3
Holy fuck. 71% of African Americans would prefer Darth Vader to Donald Trump.
Fuuuuuck.
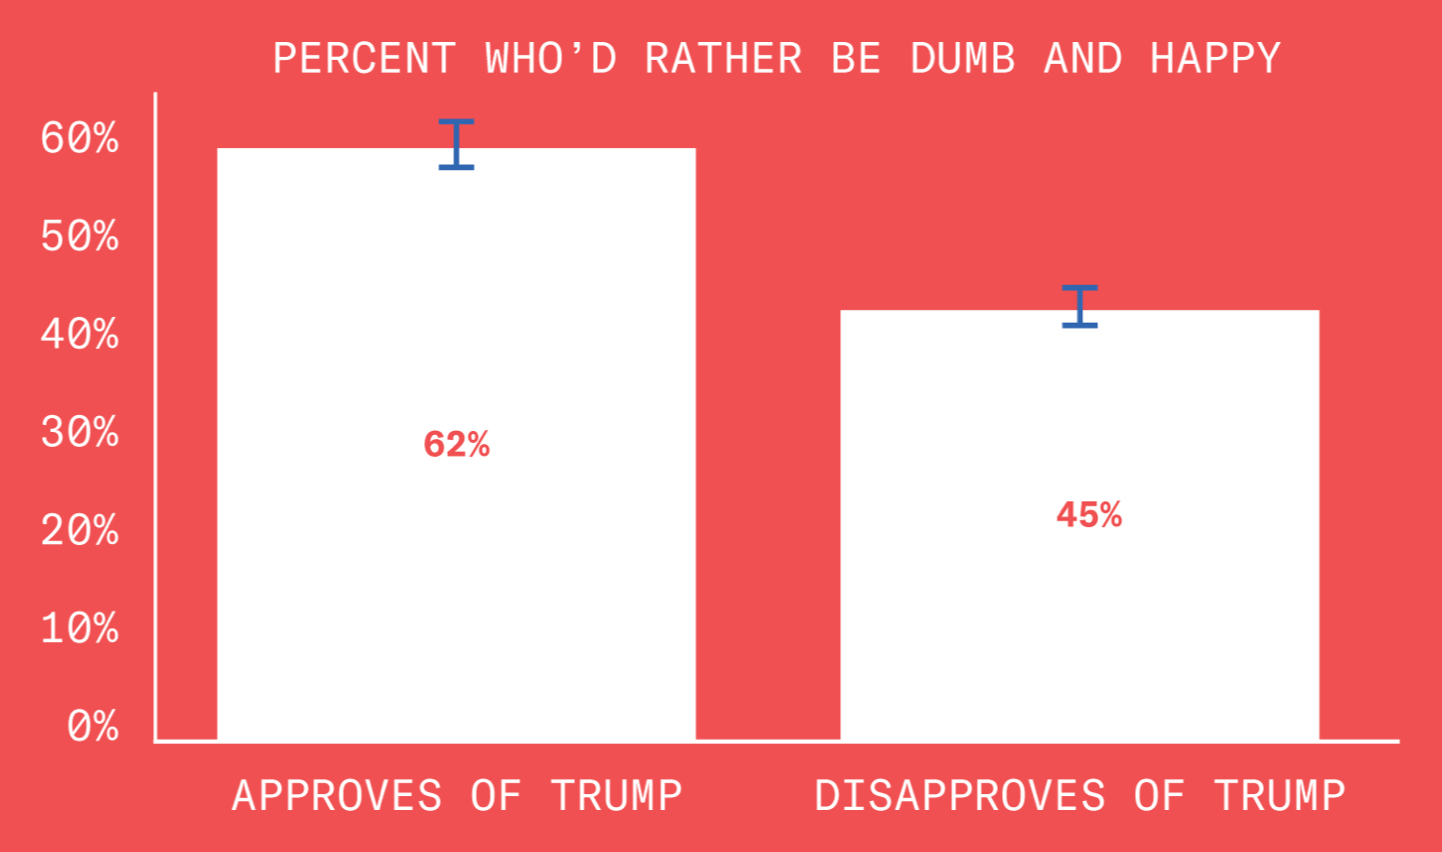
Dumb and Happy
We began our first poll with a classic dilemma: “If you had to choose, would you rather be smart and sad, or dumb and happy?”
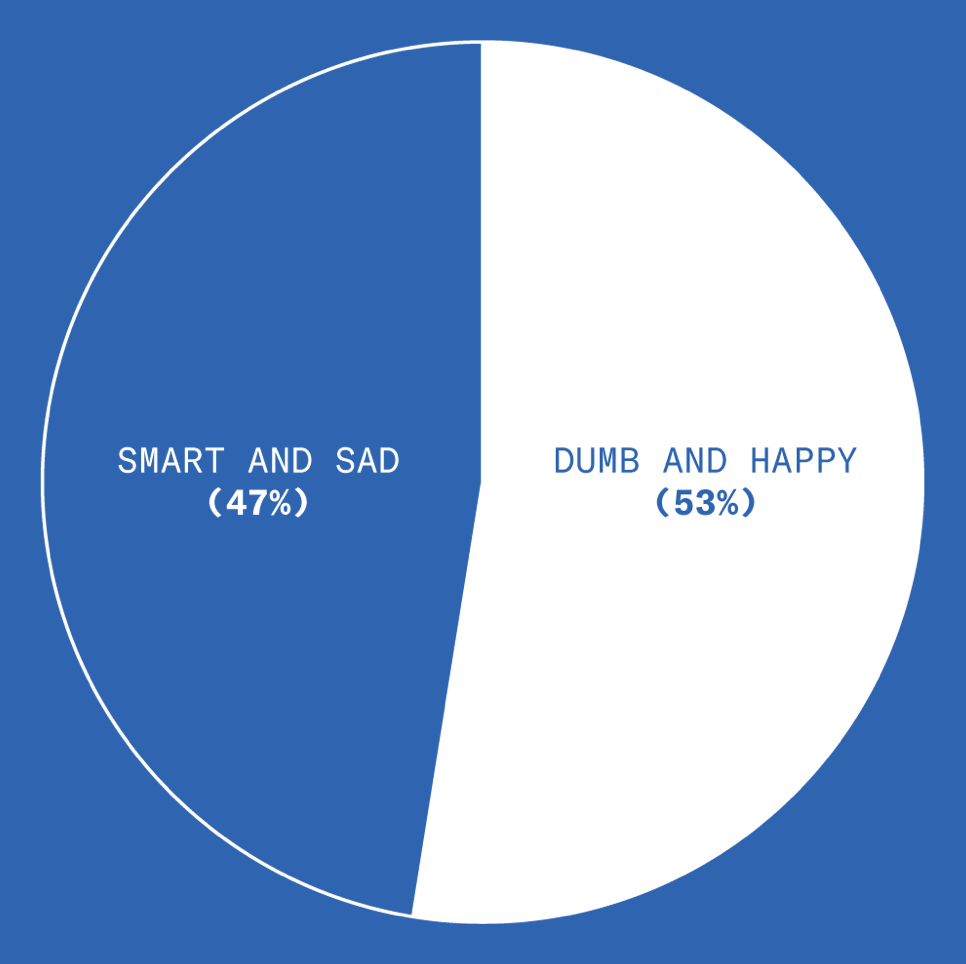
This was the most divisive question in our survey. 10% of our respondents were so flummoxed that they refused to answer.
Dumb and Happy – 2 of 3
Here’s the political breakdown:
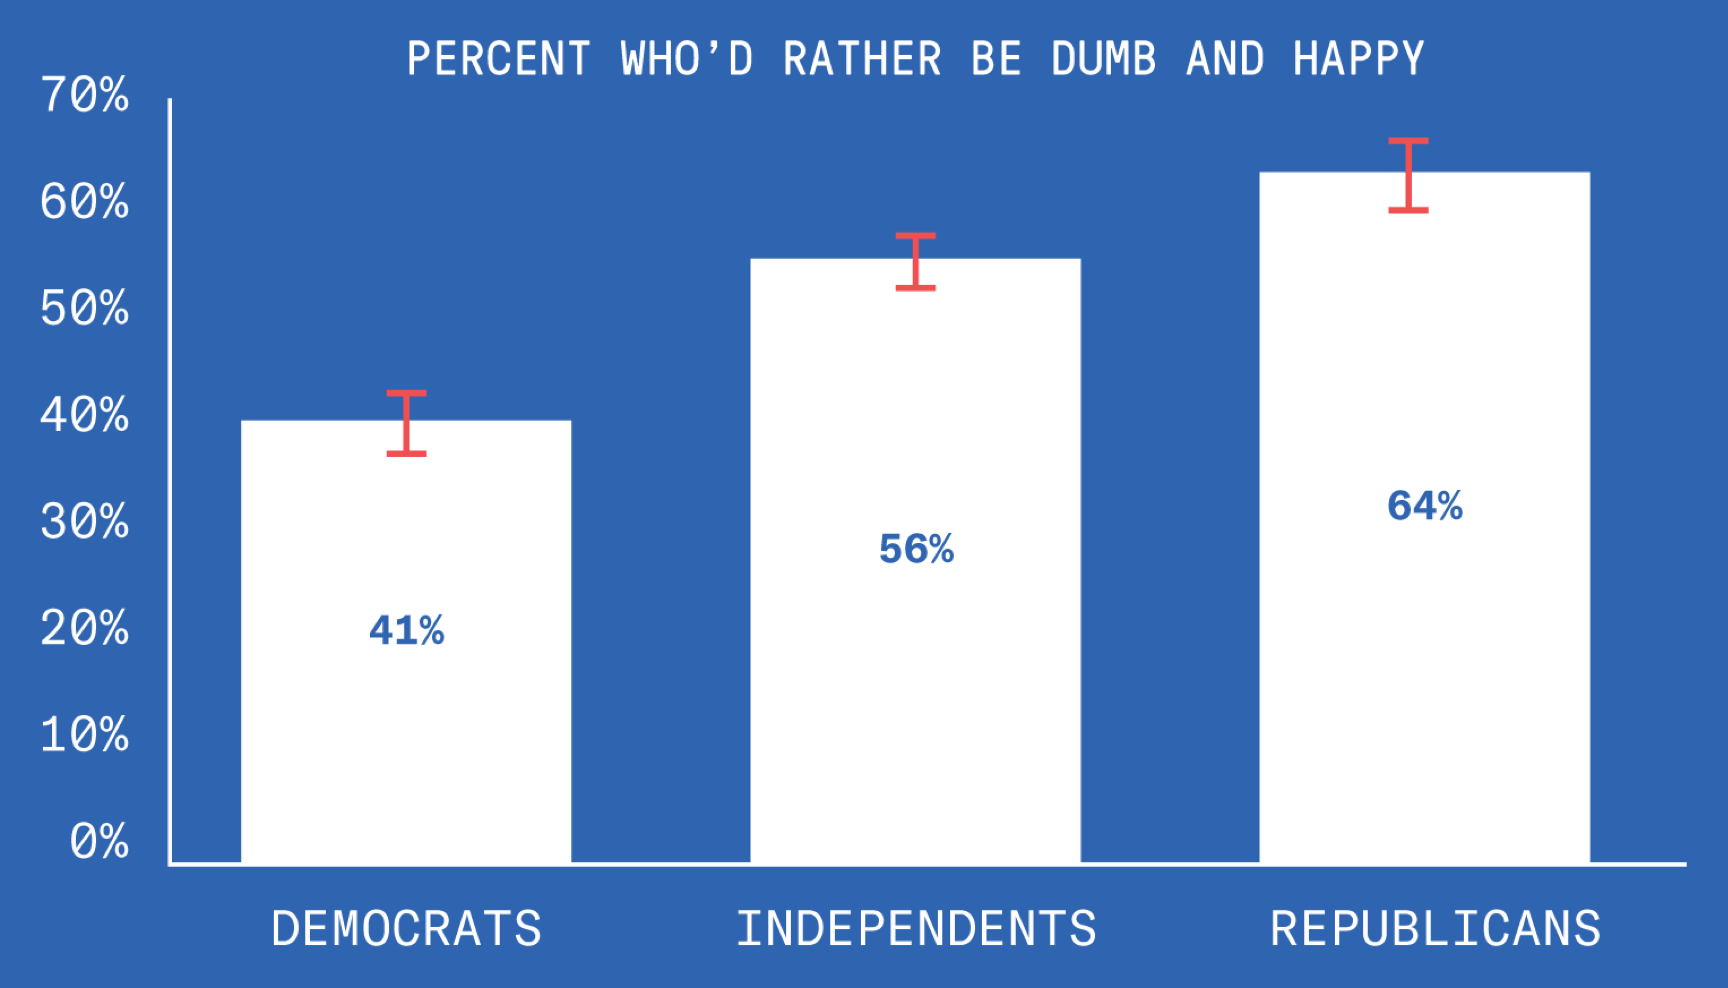
Do these results prove that Republicans are happy idiots? Science can never really “prove” anything, but fuck it: the answer is yes.
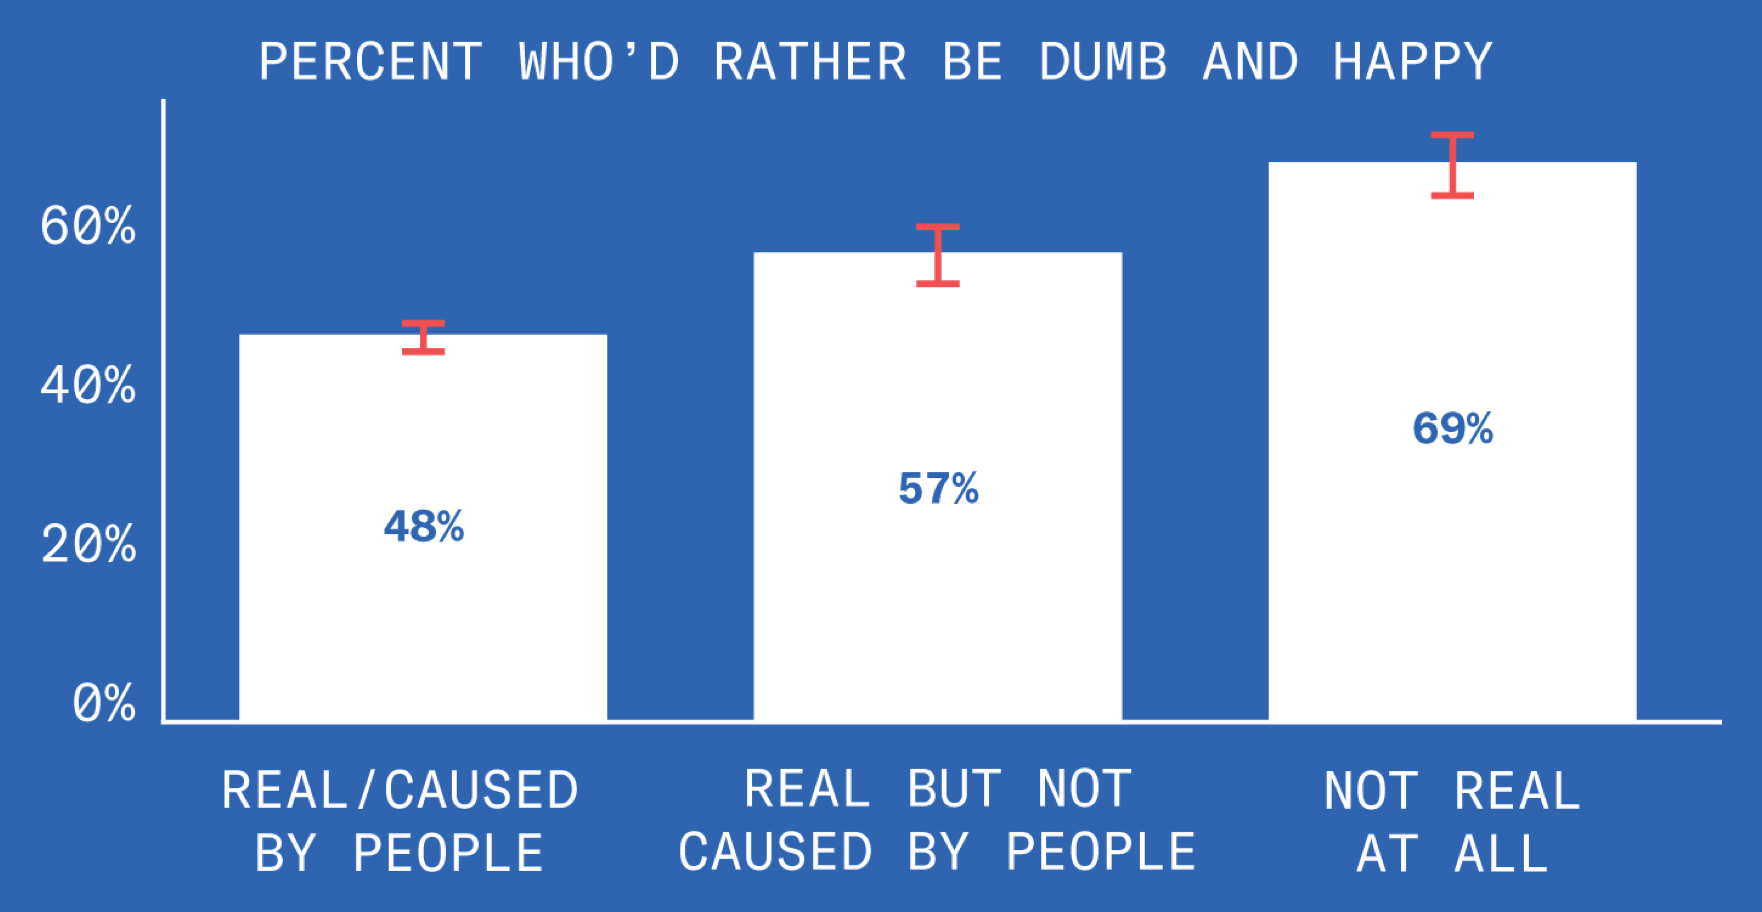
Dumb and Happy – 3 of 3
Also of interest: people who prefer being smart and sad are more likely to accept the scientific consensus on climate change.
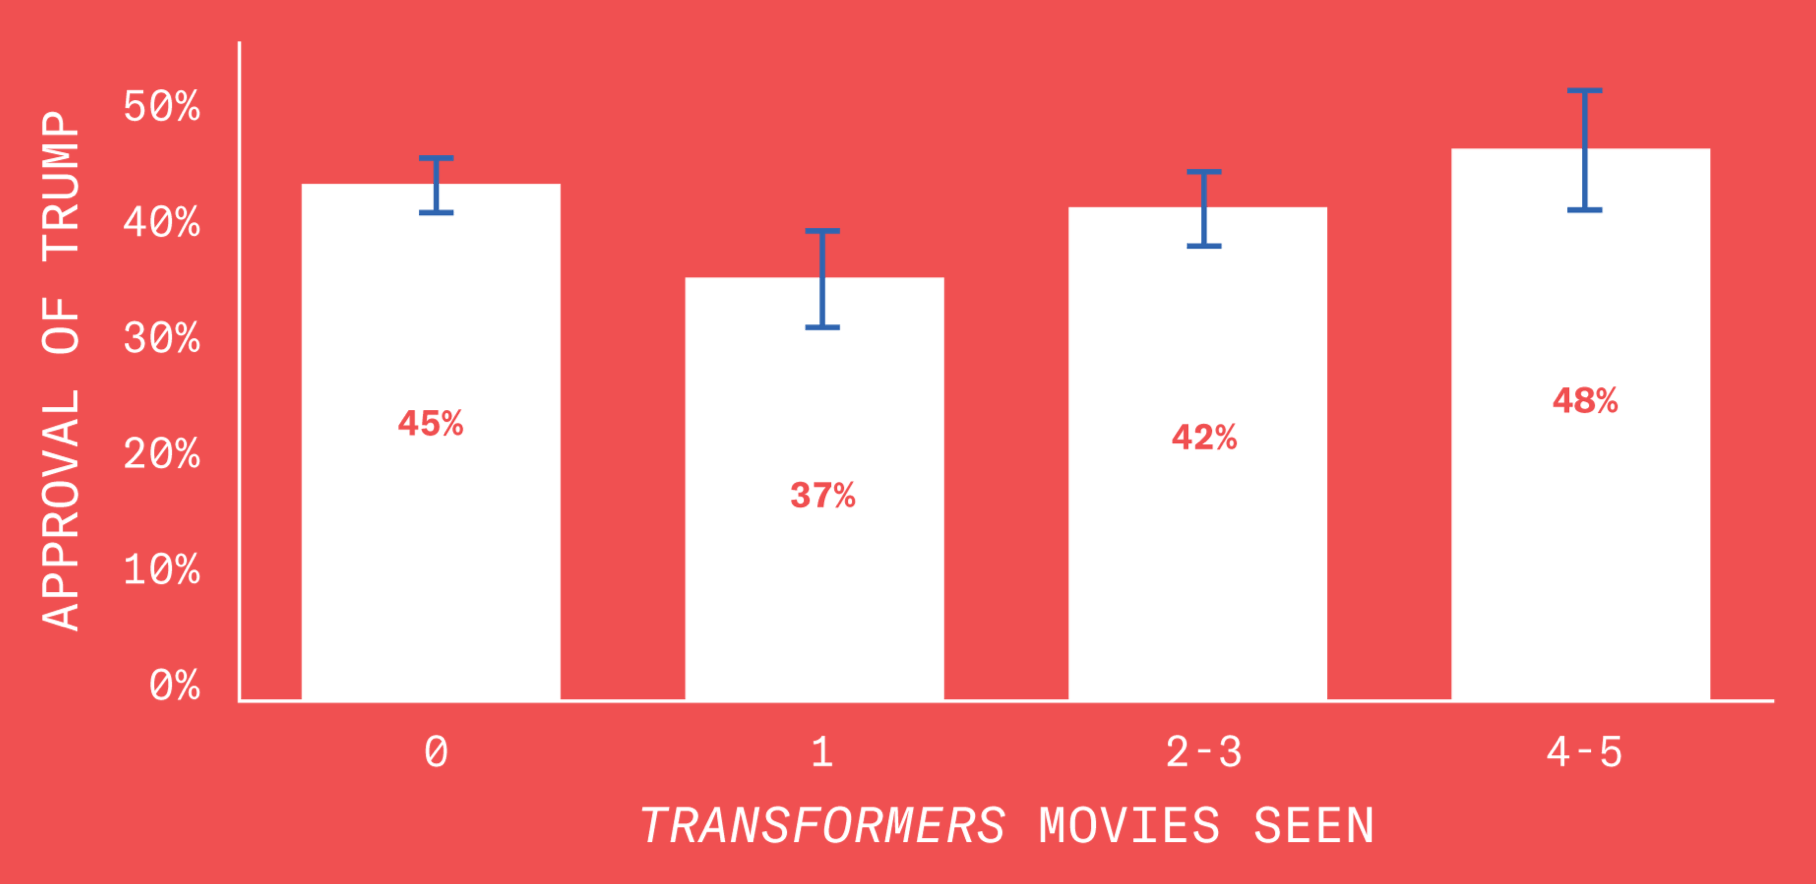
Robots
Next, we asked respondents whether they thought it was likely or unlikely that robots would take their jobs within the next decade.
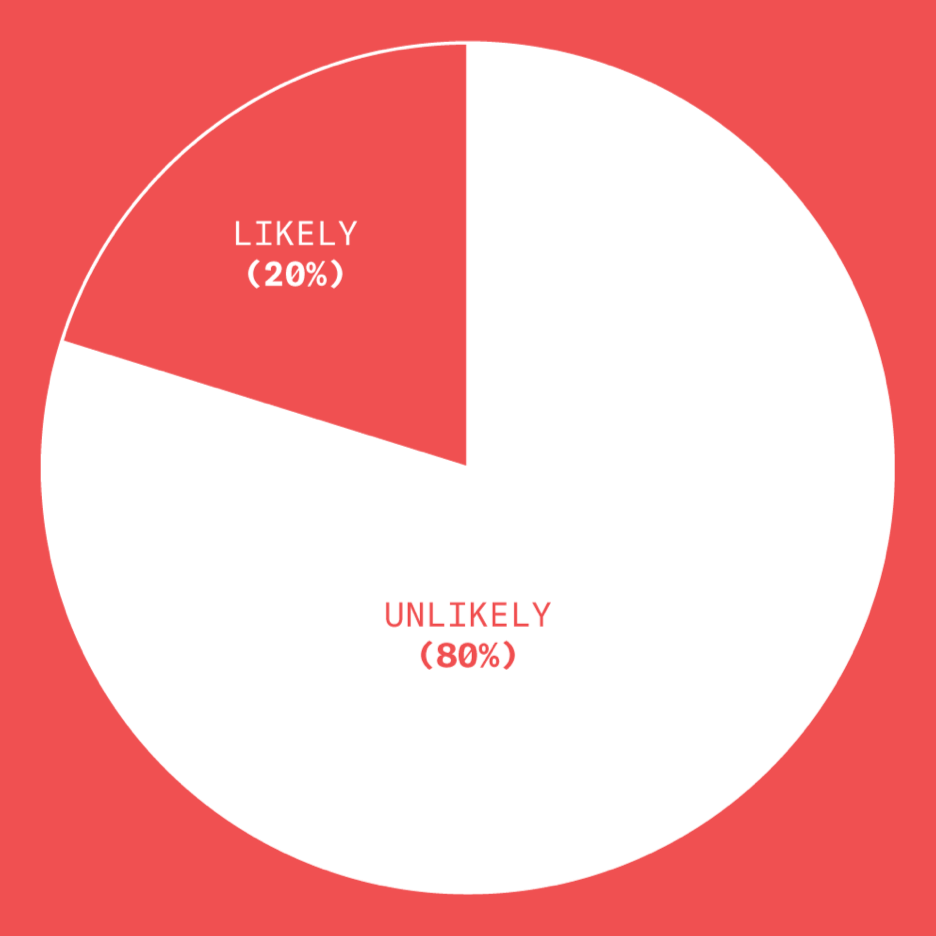
Turns out that people are not nearly as worried as they should be about technological unemployment.
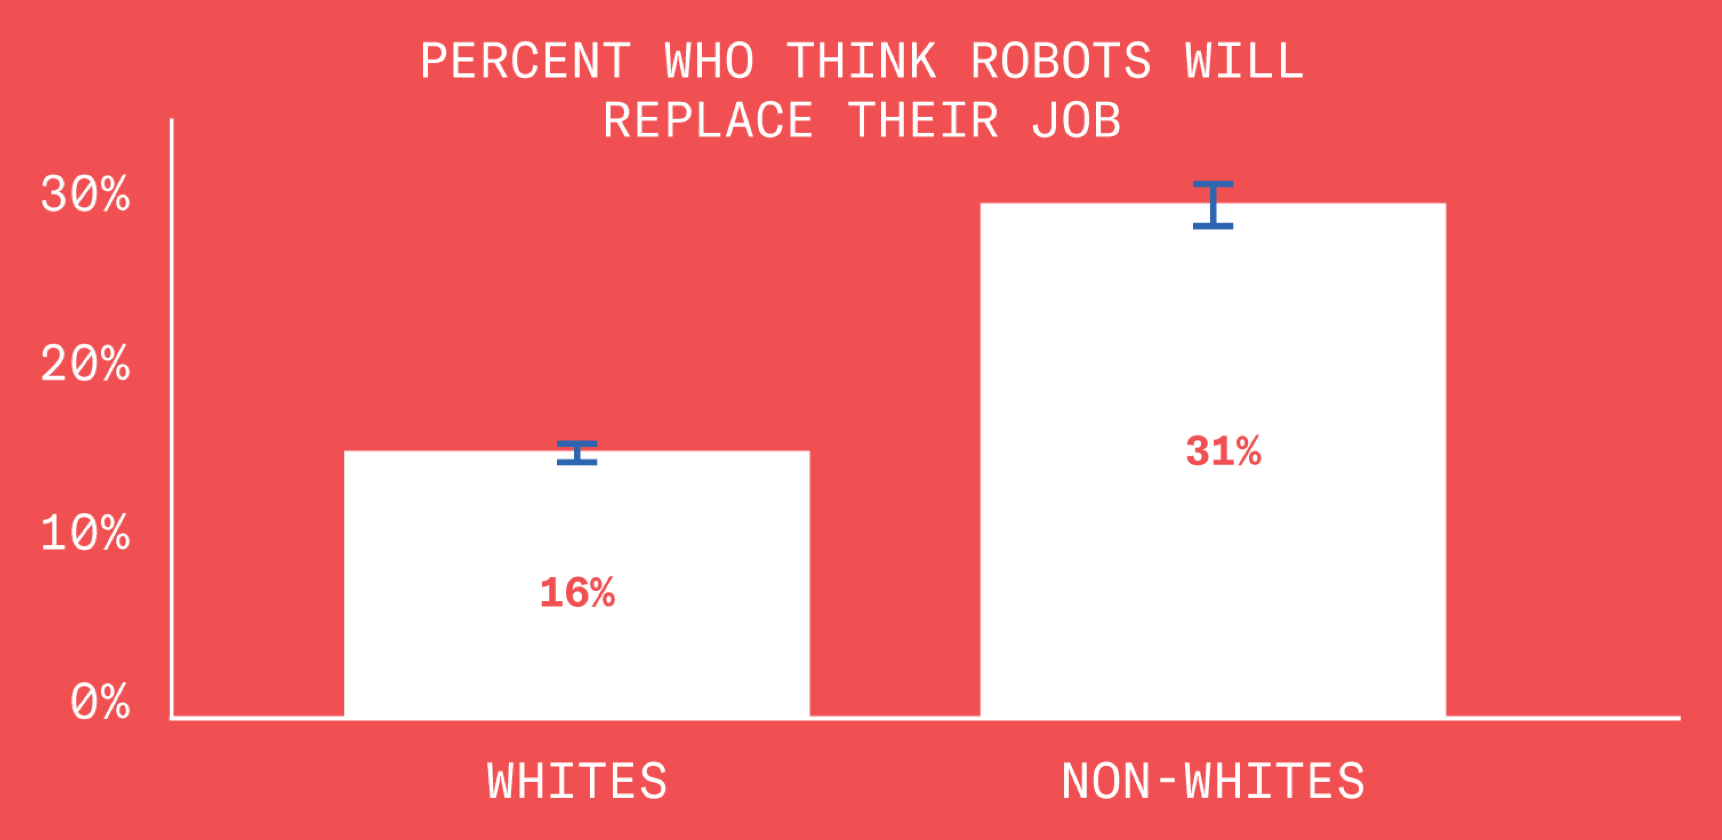
Robots – 2 of 3
Ethnic minorities are particularly worried about robots taking their jobs. White people are more worried about ethnic minorities taking their jobs.
Robots – 3 of 3
People who have seen more than one Transformers movie are especially worried about robots taking their jobs.
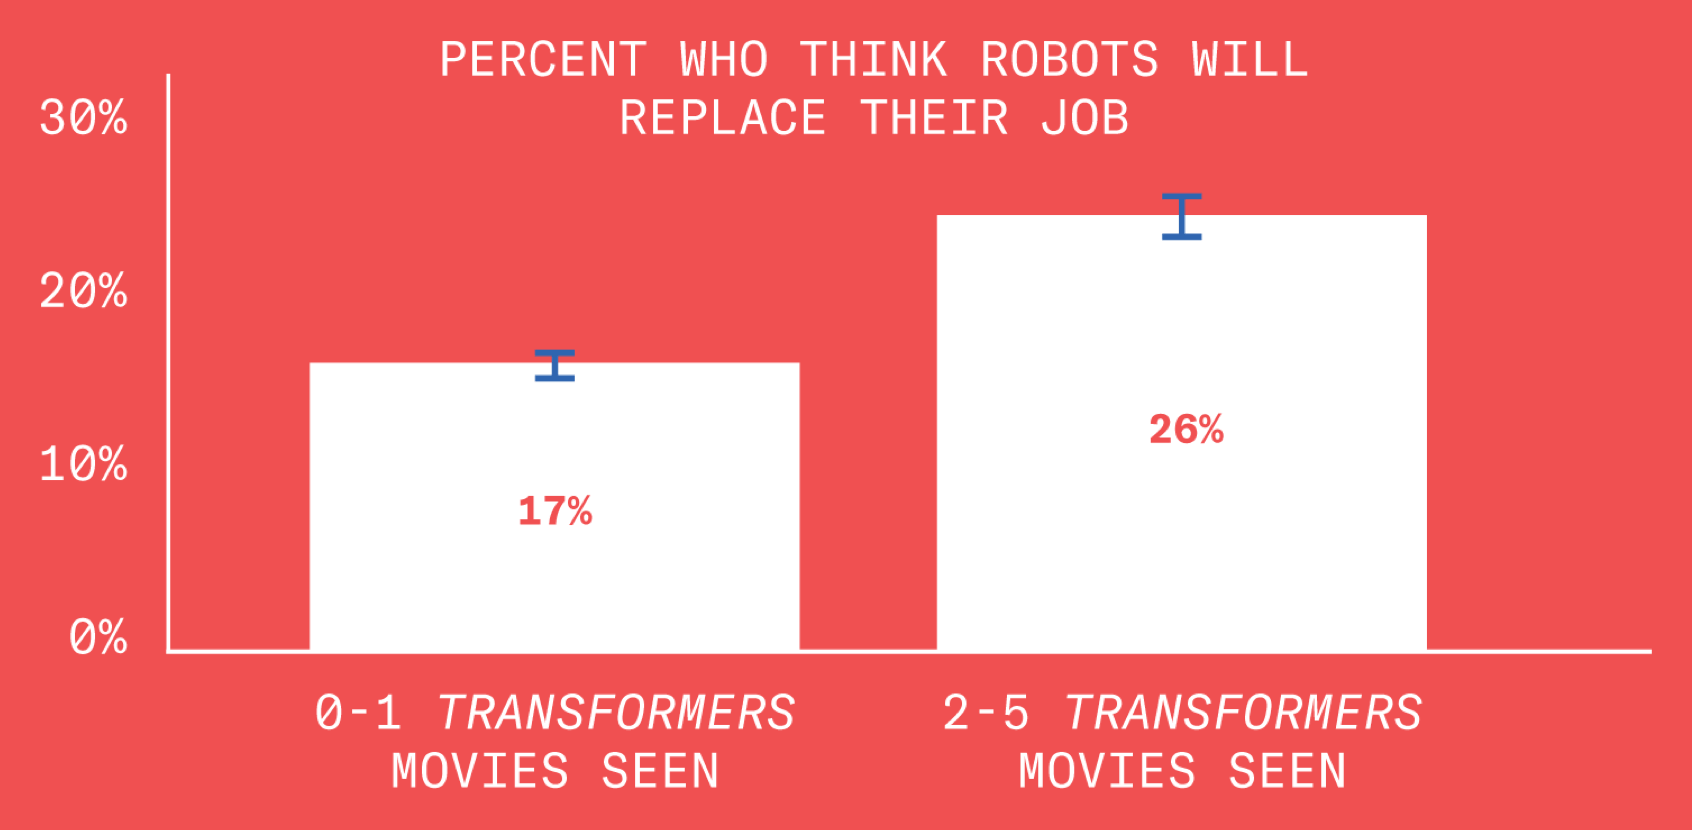
If a robot can transform into a car, then it can also transform into a customer service representative.
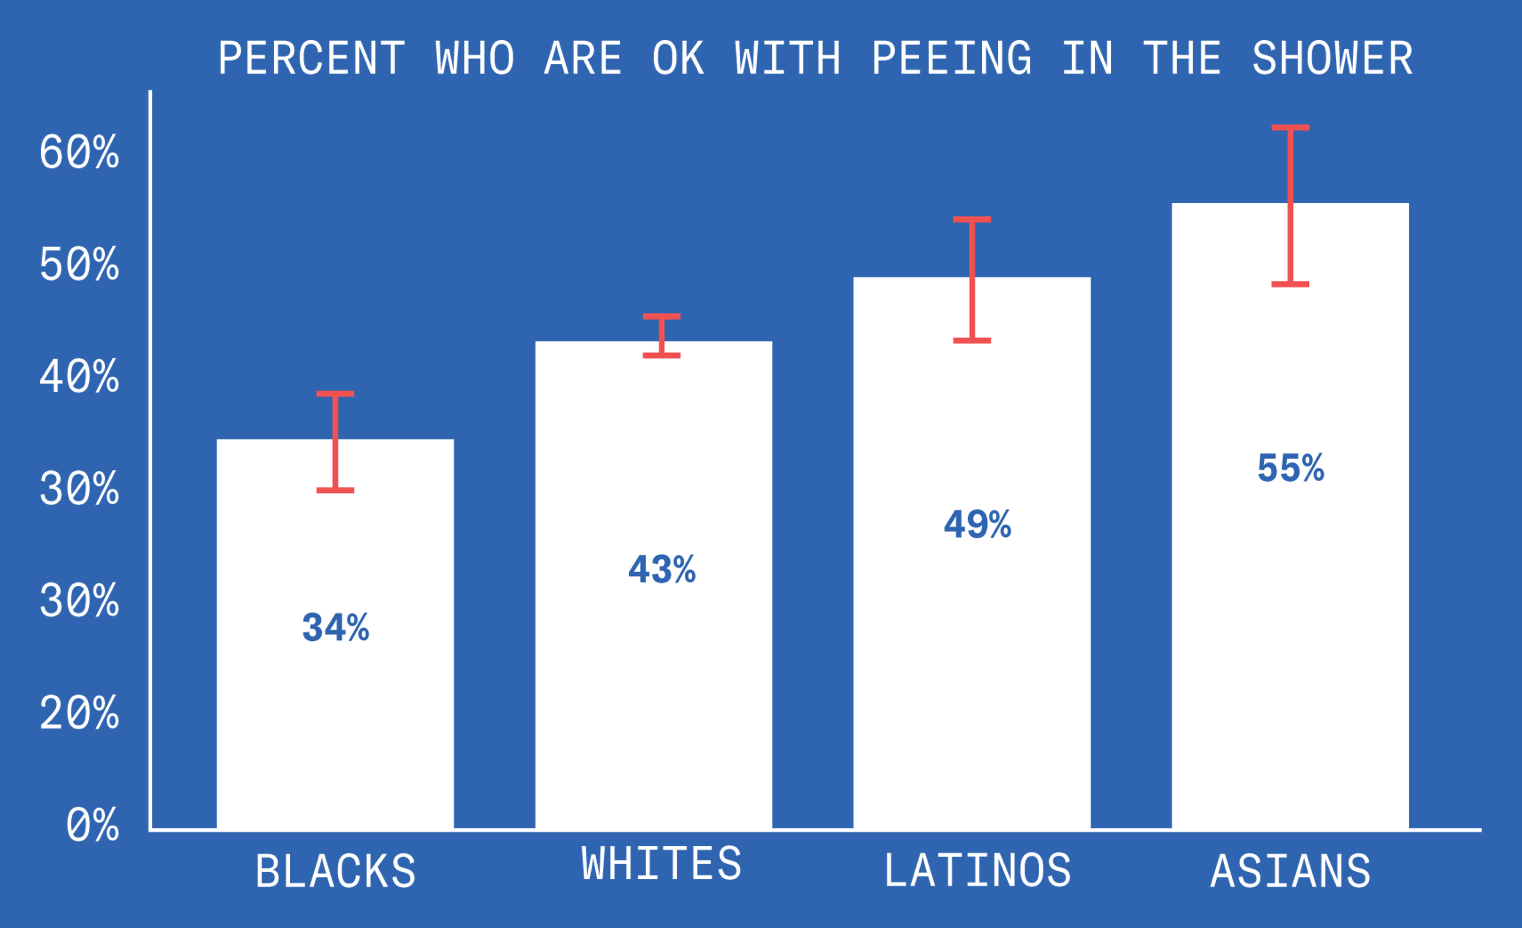
Pee-Pee
We asked people whether it is okay to pee in the shower, which it is. It’s not a big deal, folks. It all ends up in the same place.
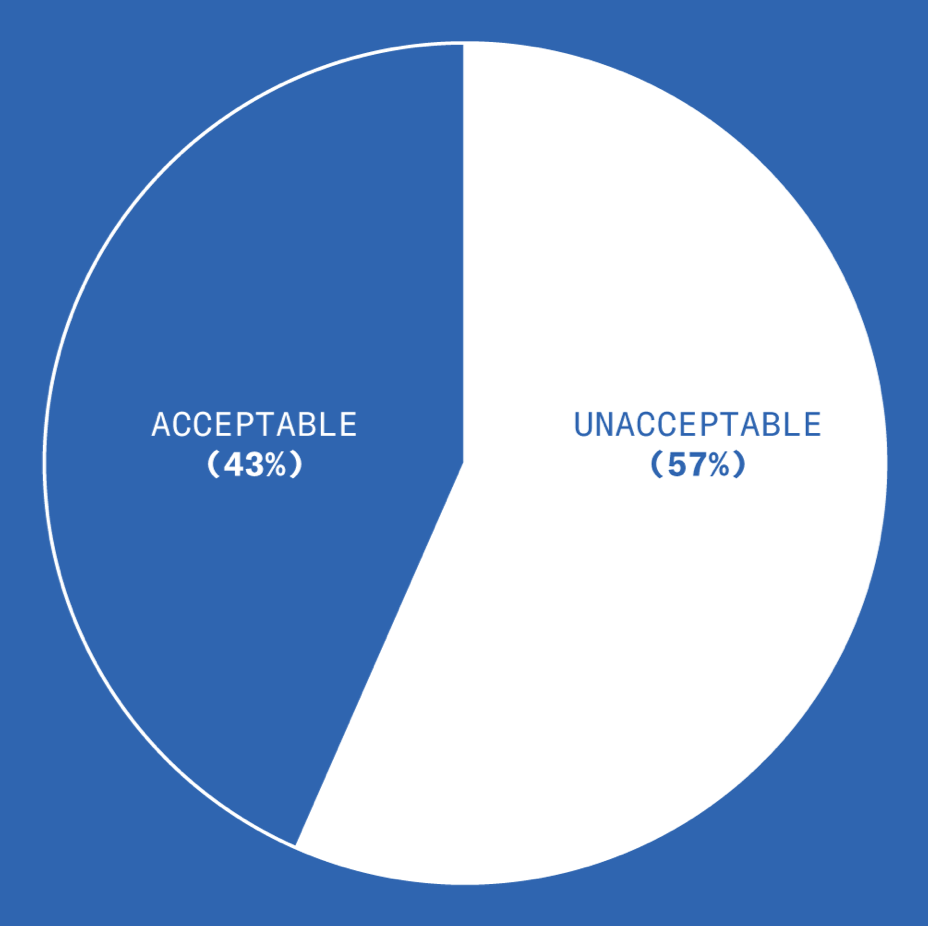
We couldn’t believe that 57% of Americans hold these outdated, puritanical pee-pee beliefs.
Pee-Pee – 2 of 3
But then we looked at the age breakdown:
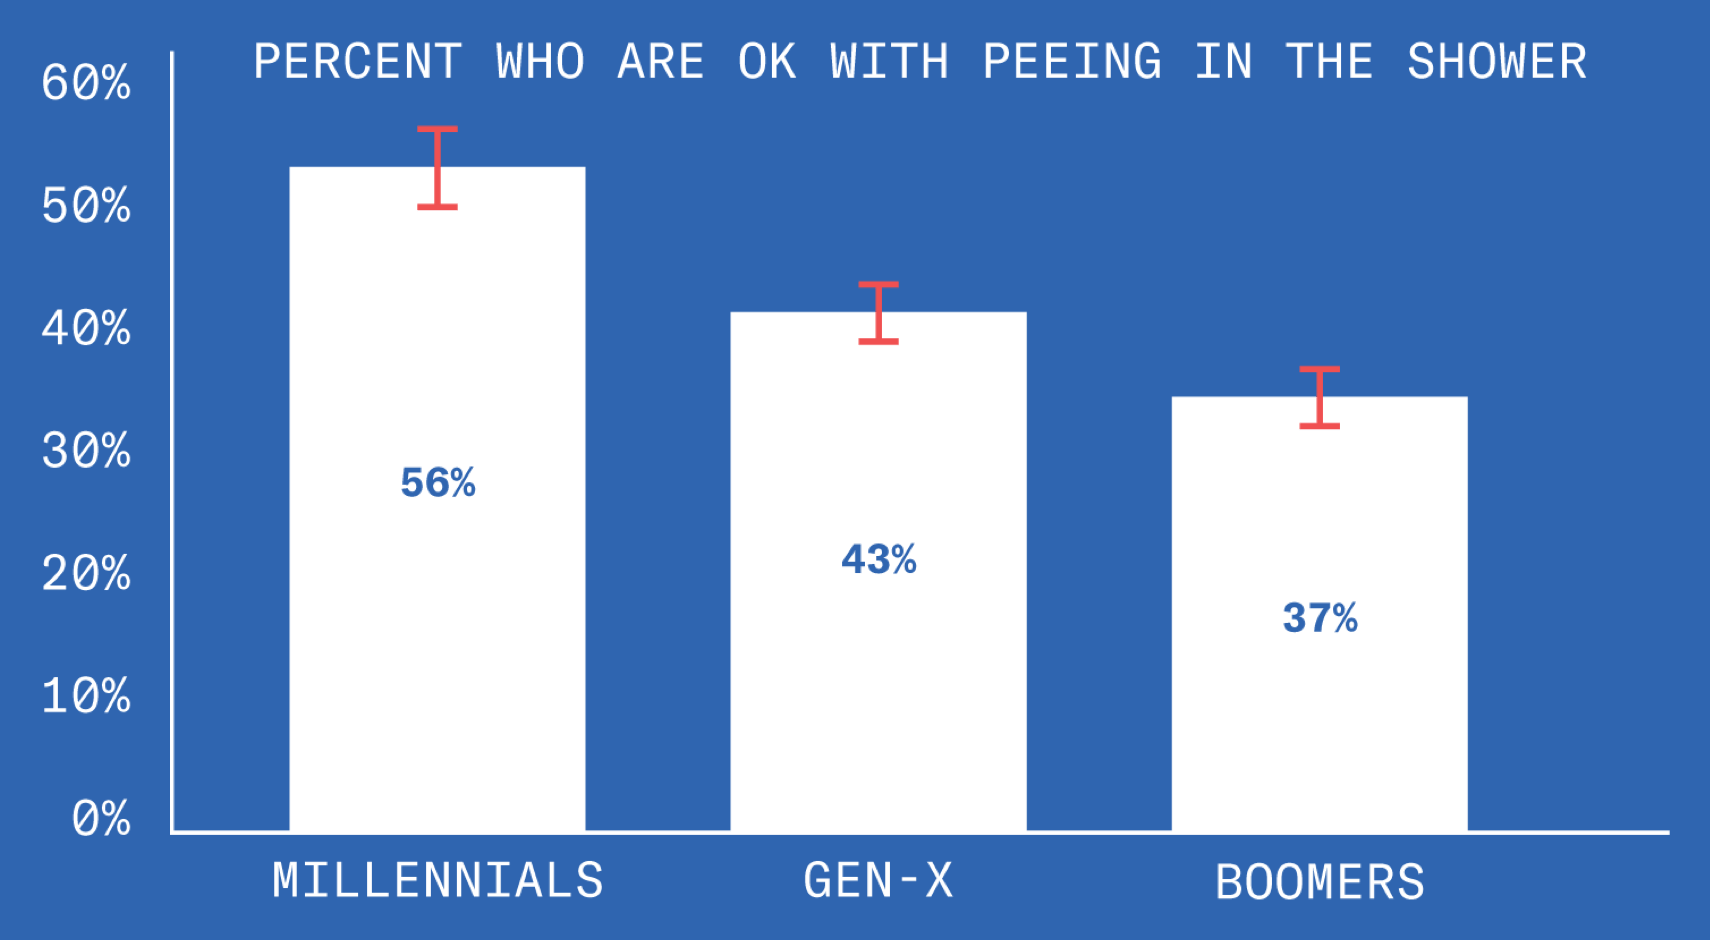
Our results indicate that we are in the midst of an inter-generational pee-pee revolution.
Pee-Pee – 3 of 3
Here’s the race breakdown. This is a great opportunity for you to write your own problematic joke!
Our Dumb President Asshole
No opinion poll would be complete without a reminder of our dumb asshole president’s depressingly non-zero approval rating.
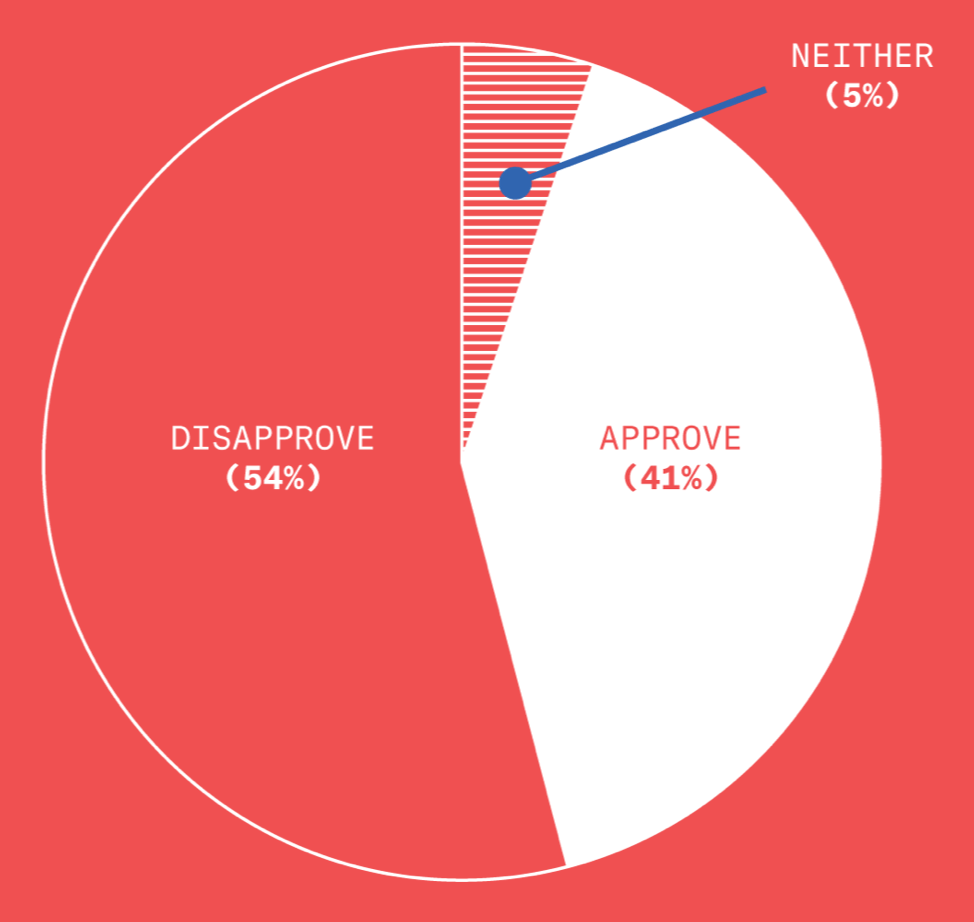
What kind of person looks at the news and says “things are going pretty well”?
Our Dumb President Asshole – 2 of 3
The same kind of person who sees one Transformers movie and says, “I’d like to see another Transformers movie.”
Our Dumb President Asshole – 3 of 3
This one’s pretty self-explanatory.
The Future
Your support of Cards Against Humanity Saves America is paying for an entire year of monthly public opinion polls. We’ll keep asking Americans about the important issues of the day, like income inequality, political polarization, and the whole Trump thing. You can find all our results so far, including the raw data, here.
- September 2017 (9/15–9/30): Raw Data and Crosstabs
- October 2017 (10/1–10/15): Raw Data and Crosstabs
- November 2017 (11/1–11/13): Raw Data and Crosstabs
- December 2017 (12/1–12/12): Raw Data and Crosstabs
- January 2018 (1/2–1/13): Raw Data and Crosstabs
- February 2018 (2/1–2/15): Raw Data and Crosstabs
- March 2018 (3/5–3/20): Raw Data and Crosstabs
- April 2018 (4/2–4/16): Raw Data and Crosstabs
- May 2018 (5/2–5/16): Raw Data and Crosstabs
- June 2018 (6/1–6/15): Raw Data and Crosstabs
- July 2018 (7/1–7/15): Raw Data and Crosstabs
- August 2018 (8/1–8/15): Raw Data and Crosstabs
Are you a social scientist or academic who studies public opinion? Want to ask Americans something that no funding agency or internal review board would approve in a million years? Maybe we can help! Apply online to get your questions included in future polls.